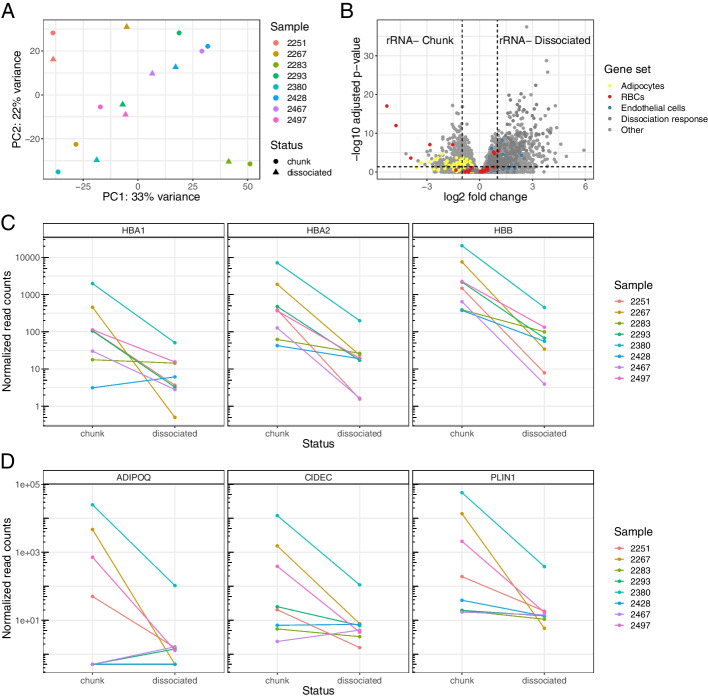
Fig. 3.
Dissociation causes disproportionate loss of red blood cells and adipocytes. A A principal component analysis of the rRNA- Chunk and rRNA- Dissociated bulk samples, where color indicates patient of origin and shape indicates dissociation status. Two points that are closer together on the PCA plot are more similar in their expression profiles. B A volcano plot of the differential expression results based on dissociation status, with gene sets of interest colored: genes known to be upregulated in adipocytes [45], endothelial cells [45], and red blood cells [44]. C Expression of hemoglobin genes in each sample based on dissociation status. D Expression of selected adipocyte-related genes based on dissociation status

