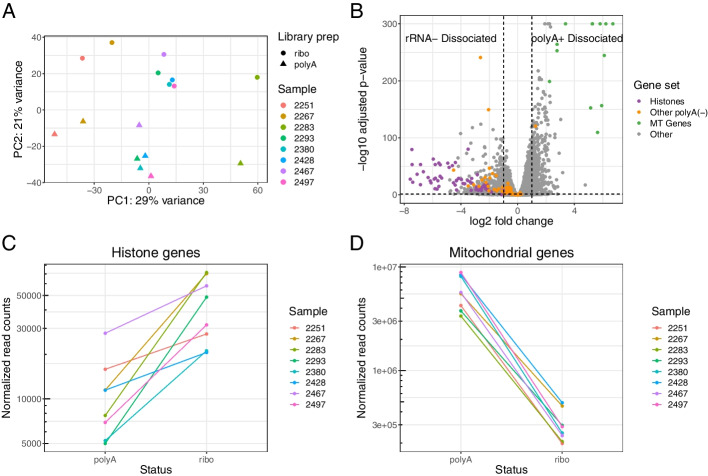
Fig. 4.
Method of mRNA enrichment affects gene expression profile. A A principal component analysis of the rRNA- Dissociated and polyA+ Dissociated bulk samples, where color indicates patient of origin and shape indicates whether samples were poly-A captured or rRNA depleted. Two points that are close together on the PCA plot are similar in their expression profiles. B A volcano plot of the differential expression results based on mRNA enrichment method, with gene sets of interest colored: histones, other non-polyadenylated genes [53], and mitochondrial genes. C Combined expression of all histone genes in each sample based on mRNA enrichment method. D Combined expression of all mtDNA genes based on mRNA enrichment method

