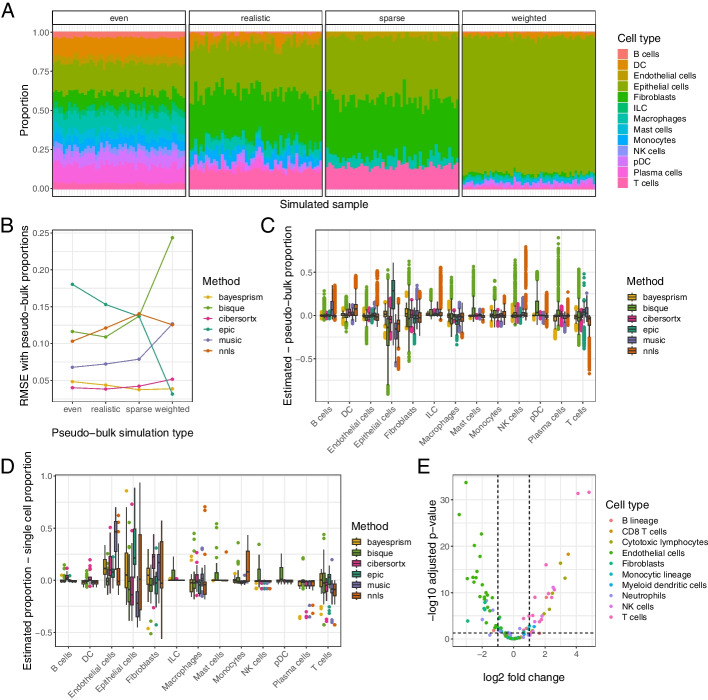
Fig. 5.
Deconvolution methods show cell type bias in real data. A RNA abundances from the four different simulation scenarios to generate pseudo-bulk data from our single-cell samples, shown with a single sample. For each pseudo-bulk dataset, we pre-set proportions of cells based on the simulation scenario and then randomly sampled from each cell type at those proportions. B The average root mean squared error (RMSE) between cell type proportions estimated by various deconvolution methods and the true simulated proportions, stratified by simulation type. C The difference between deconvolution estimates for our pseudo-bulk data and their true RNA abundance proportions across all simulation scenarios, stratified by cell type. A score of 0 indicates perfect concordance between the deconvolution estimate and the true pseudo-bulk value. D The difference between deconvolution estimates for our real data and the proportion of RNA reads mapping to that cell type in the corresponding sample’s single-cell data. E A volcano plot of differential expression in cell type markers between pseudo-bulk (non-simulated, aggregating all reads from all single-cells in the sample) and polyA+ Dissociated real bulk data. Genes are selected and colored based on the signature matrix from MCPcounter [61]

