Fig. 6.
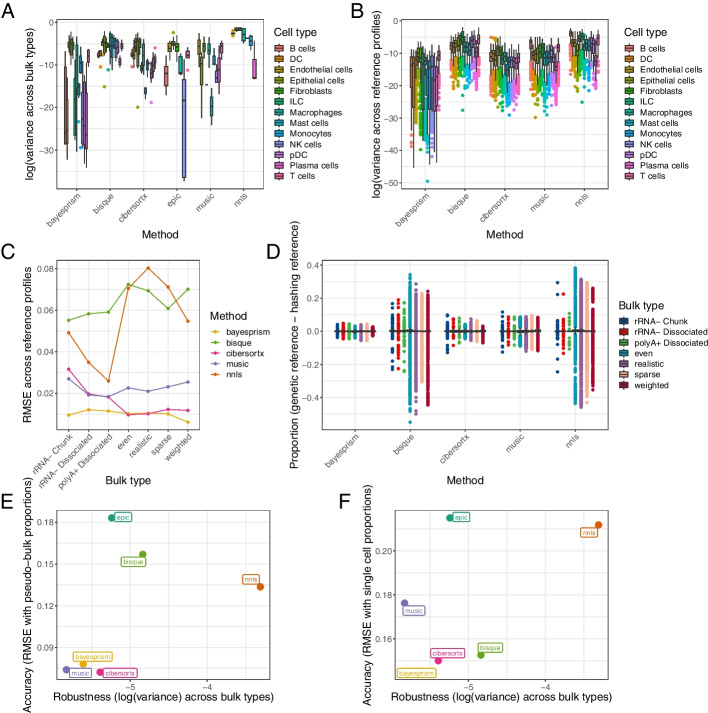
Deconvolution methods vary in robustness to changes in bulk and single-cell data. A Variance of deconvolution results across bulk data type. For each method, we calculated the variance between the estimated proportion for a given cell type in a given sample in the rRNA- Chunk, rRNA- Dissociated, and polyA+ Dissociated data. B Variance of deconvolution results across reference profile size. For each method, we calculated the variance between the estimated proportion of a given cell type in a given sample when using cells assigned by genetic demultiplexing (n = 14,608) as a reference vs. using cells assigned by antibody-based demultiplexing with default parameters (n = 7574). C The average RMSE between cell type proportions using a smaller and larger reference profile. D The average difference between cell type proportion estimates using the smaller vs. the larger reference profile, stratified by bulk/pseudo-bulk data type. E The final accuracy vs. robustness result for each method based on pseudo-bulk data, with variance in estimates for bulk data types and RMSE between estimate and simulated proportions for pseudo-bulk data. F Accuracy vs. robustness of each method based on true bulk data, with variance in estimates for bulk data types and RMSE between real bulk estimate and real single-cell proportion

