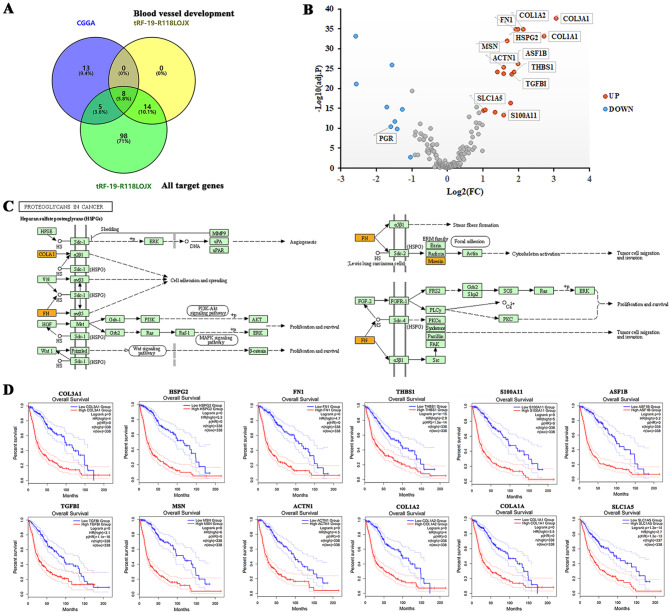
Fig. 5.
The upregulated target genes of tRF-19-R118LOJX promote tumorigenesis and predict poor overall survival of GBM patients. (A) Venn diagram for overlapped DEGs of CGGA between LGG and GBM, the target genes of tRF-19-R118LOJX enriched by blood vessel development and all target genes of tRF-19-R118LOJX. (B) Volcano plot of DEGs of CGGA and the differentially expressed target genes of tRF-19-R118LOJX (indicated using data tag) for LGG vs. GBM of CGGA. The red points indicate upregulated genes (n = 17), and the blue points indicate downregulated genes (n = 9) with absolute fold change values greater than 2 being statistically significant. Non-differentially expressed genes are indicated in gray. (C) KEGG mapping of proteoglycans in cancer is the most enriched pathway of the differentially expressed target genes of tRF-19-R118LOJX. Orange-marked nodes correspond to target genes from tRF-19-R118LOJX. (D) Overall survival analysis of the upregulated target genes of tRF-19-R118LOJX in GBM vs. LGG.

