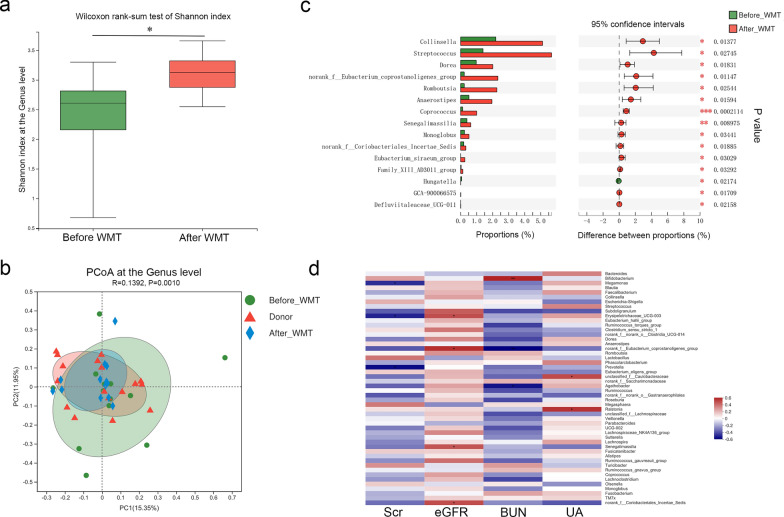
Fig. 6.
Gut microbiota profiles in patients with renal dysfunction before and after WMT. a Shannon’s diversity index at the genus level; b Principal coordinate analysis (PCoA) of microbiota composition at the genus level; c Wilcoxon rank-sum test bar plot of relative abundances of the top 15 differential genera; d Heatmap of the correlations of genus-level abundances and renal parameters. BUN, blood urea nitrogen; eGFR, estimated glomerular filtration rate; SCr, serum creatinine; UA, uric acid; WMT, washed microbiota transplantation. *P < 0.05; **P < 0.01; ***P < 0.001

