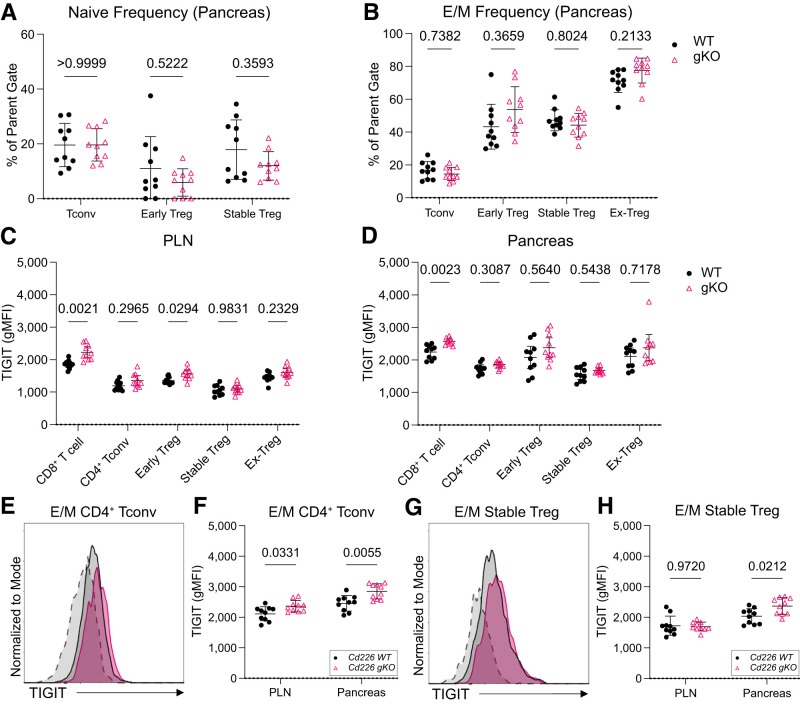
Figure 3.
Pancreatic E/M CD4+ Tconv and stable Tregs have increased TIGIT expression in Cd226 gKO mice. Frequency of naive (CD44−CD62L+) (A) and E/M (CD44+CD62L−) (B) Tconv and Treg subsets from the pancreata of 12-week-old female Cd226 WT and gKO Treg fate-tracking NOD mice. Quantification of TIGIT gMFI in CD8+ T cells, GFP−YFP− CD4+ Tconv, GFP+YFP− early Treg, GFP+YFP+ stable Treg, GFP−YFP+ ex-Treg in the PLN (C) and pancreas (D) of 12-week-old female mice. Overlaid histograms showing TIGIT expression on pancreatic E/M CD4+ Tconv cells (E) and quantification of TIGIT expression on E/M CD4+ Tconv (F) in the PLN and pancreas of 12-week-old female Cd226 WT and gKO Treg fate-tracking NOD mice. FMO negative staining controls are displayed in the dashed histogram. G and H: Same as E and F but for pancreatic E/M stable Tregs. Lines indicate the mean, and error bars display the SD. P values are shown for multiple t tests with the Šidák-Bonferroni multiple test correction (n = 10).

