Figure 1.
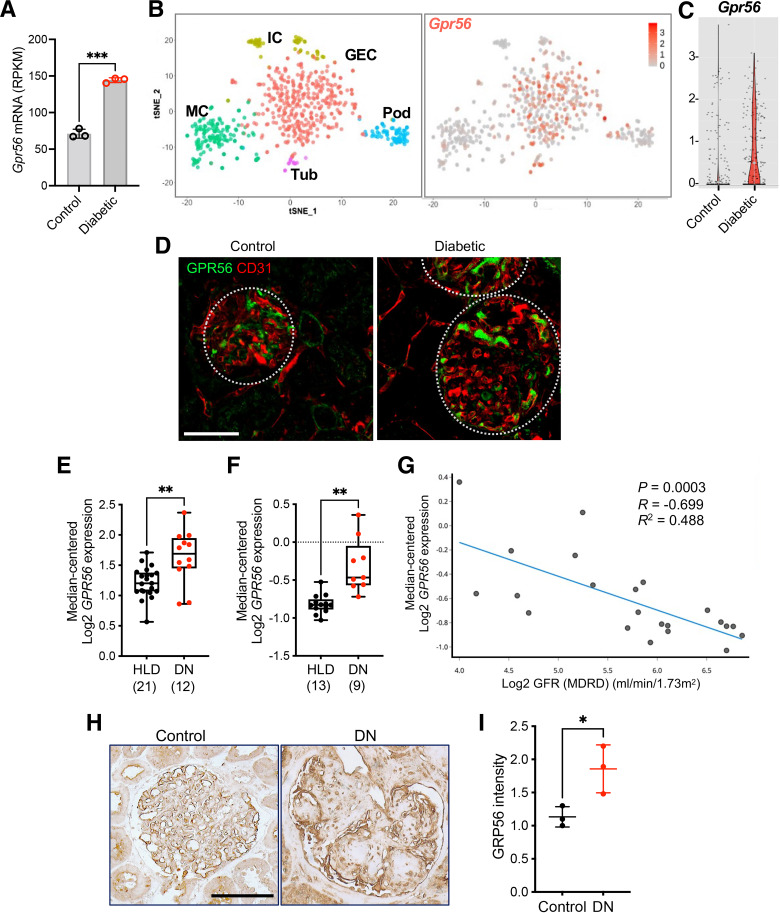
Glomerular GPR56 expression is increased in DKD. A: Gpr56 expression from bulk RNA-sequencing data of isolated GECs (12) show elevated Gpr56 mRNA expression in diabetic mice. Each sample represents isolated GECs pooled from three or four mice. RPKM, reads per kilobase per million. ***P < 0.001 when compared between two groups by two-tailed Welch’s t test. B and C: Small conditional RNA-sequencing analysis of glomerular cells (25) shows an enriched expression of Gpr56 in GECs (B) and enhanced expression in diabetic mouse GECs (C). Gene expression is shown on a log scale, and each dot represents a single GEC. D: Representative images of GPR56 (green) costained with CD31 (red) of control and diabetic eNOS-null mouse kidneys. Scale bar: 50 μm. E and F: GPR56 mRNA expression in microdissected glomeruli samples from diabetic nephropathy (DN) and healthy living donors (HLD) in the Ju chronic kidney disease (CKD) glom data set (GSE47185, E) and Woroniecka diabetes glom data set (GSE30122, F) from the Nephroseq database (nephroseq.org). The sample size of each group is shown in parentheses. **P < 0.01 between two groups by Welch’s t test. G: Pearson correlation analysis between GPR56 mRNA expression and estimated glomerular filtration rate in DN (nephroseq.org; data set GSE30122). H: Representative images of GPR56 immunostaining in glomeruli of control nephrectomy specimen (control) and DN biopsy samples. Scale bar: 100 µm. I: Quantification of optical density of GPR56 immunostaining (n = 3 patient samples/group) in arbitrary units. *P < 0.05 between two groups by unpaired t test.

