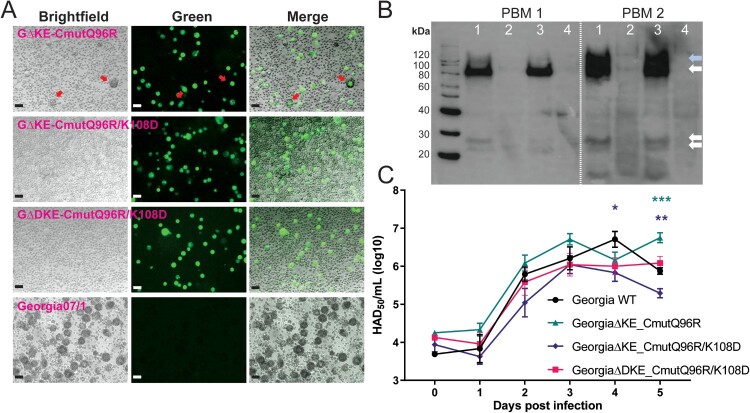
Figure 3.
In vitro characterization of ASFV recombinant viruses expressing mutant CD2v. Panel (A) shows brightfield images of PBM cells infected with the recombinant or wildtype Georgia07/1 viruses, mNeonGreen expression in infected cells (green), and a merged image overlaying brightfield and green channels. The red arrows in GΔKE_CmutQ96R-infected cells show reduced numbers of rosettes compared to the wildtype virus. The scale bars represent 25 µm. Panel (B) shows Western blots of lysates of PBMs from two pigs infected at 0.1 MOI with GΔKE_CmutQ96R (Lane 1) and GΔDKE_CmutQ96R/K108D (Lane 3) at 4 dpi and probed to detect the C-terminal HA epitope tag. HA-specific bands were not detected in lanes with mock-infected (lane 4) or GΔKE_CmutQ96R/K108D-infected cell lysates (lane 2). This virus lacks the C-terminal HA tag. Arrows show bands of expected molecular weight for full-length glycosylated (∼80 kDa) CD2v or the C-terminal cleavage fragment. The blue arrow shows a higher MW (∼120 kDa) CD2v detected at higher levels lysates from infected PBMs from pig 2. Panel (C) shows titres of virus harvested from combined cell extracts and supernatants at different days post-infection of PBMs infected with wildtype or recombinant ASFV at 0.01 MOI in triplicate. Significant differences are represented by asterisk where * is p < 0.05, ** is p < 0.01, *** is p < 0.001, and **** is p < 0.0001; the colour of the asterisk represents the respective virus.

