
Figure 2.
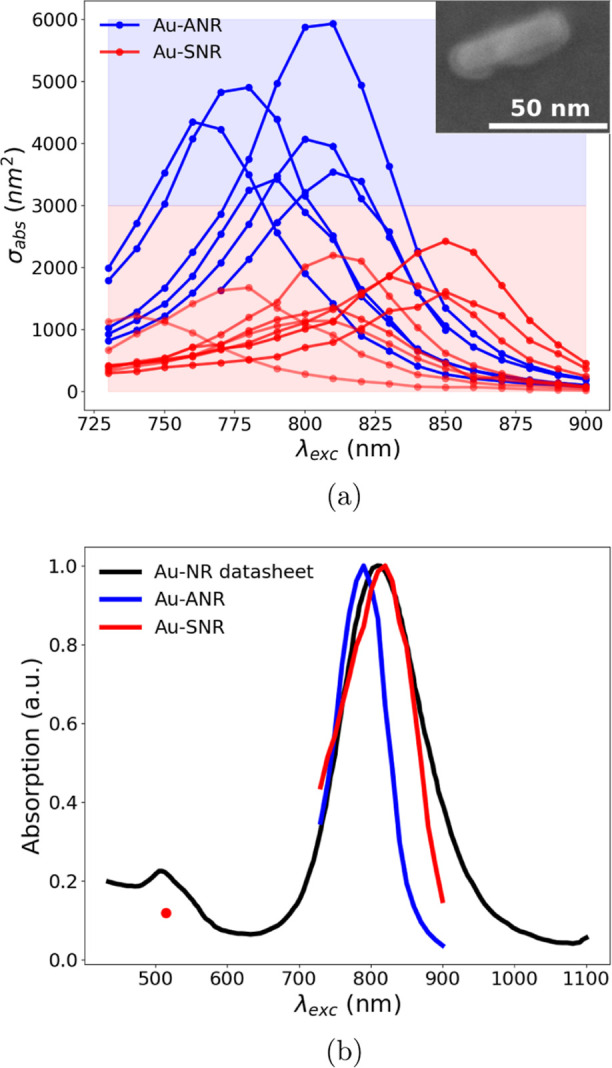
(a) Measured absorption cross-section spectra of single nanorods (Au-SNR, red curves) and small nanorod aggregations (Au-ANR, blue curves), showing the heterogeneity characterizing these samples, mainly caused by the particle size dispersion. Inset: SEM micrograph of a single silica-coated gold nanorod landing on the drum resonator. (b) Red curve and dot: renormalized sum of the measured absorption cross-section spectra of single nanorods (a); blue curve: renormalized sum of the absorption cross-sections of the nanorods aggregation; black curve: ensemble average absorption spectrum given by the datasheet.