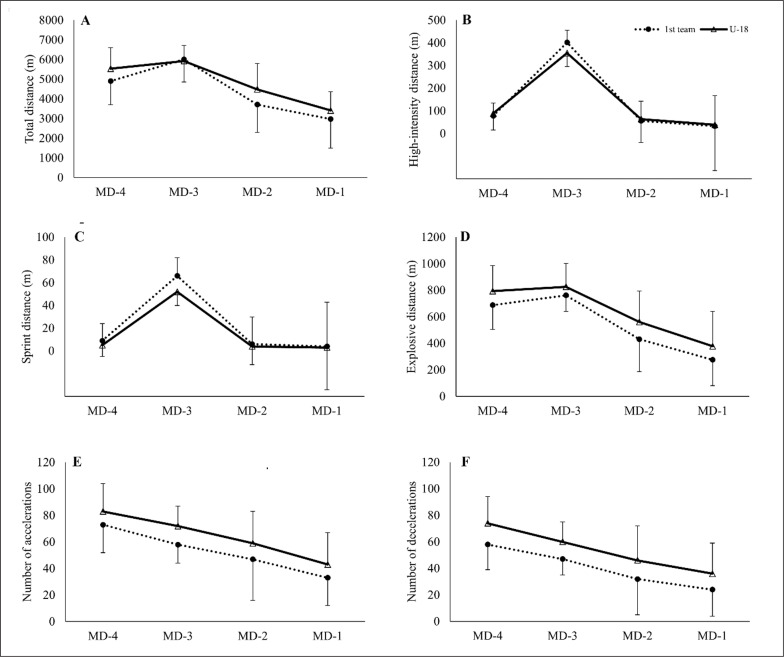
FIG. 1.
Mean and standard deviation values of total distance (A), high-intensity distance (B), sprint distance (C), explosive distance (D), the number of accelerations (E), and the number of decelerations (F) across the training microcycle from the two examined teams. The dotted line with black circles: first-team; solid line with white triangles: U-18.

