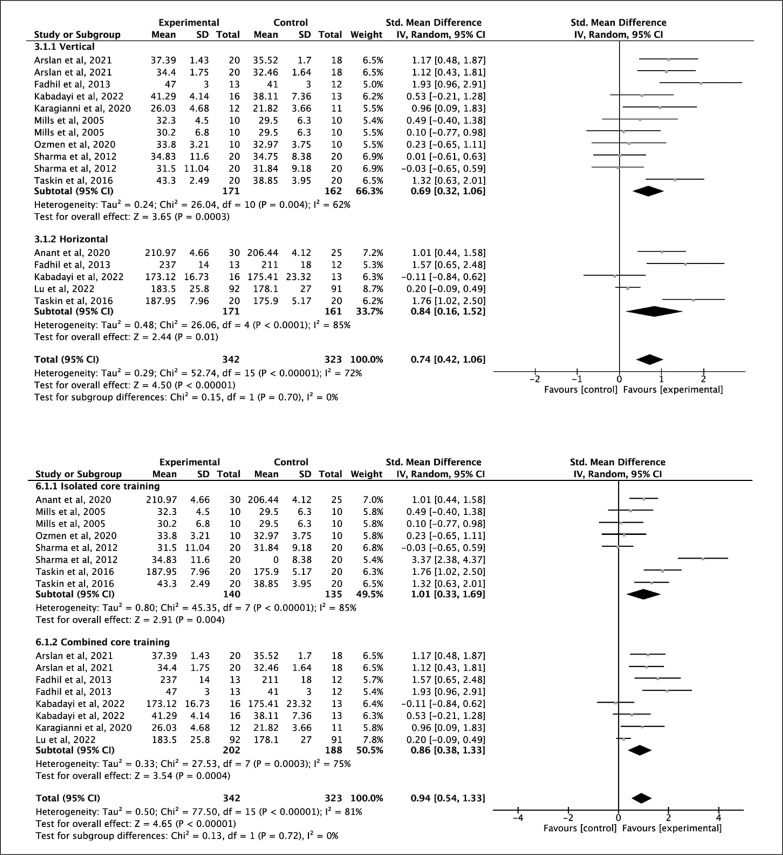
FIG. 5.
Forest plot of comparison of vertical jump for core training vs control group and forest plot of comparison of horizontal jump for core training vs control group and (upper figure) and forest plot of comparison of isolated core training vs control group and forest plot of comparison of combined core training vs control group (down figure).

