Figure 1.
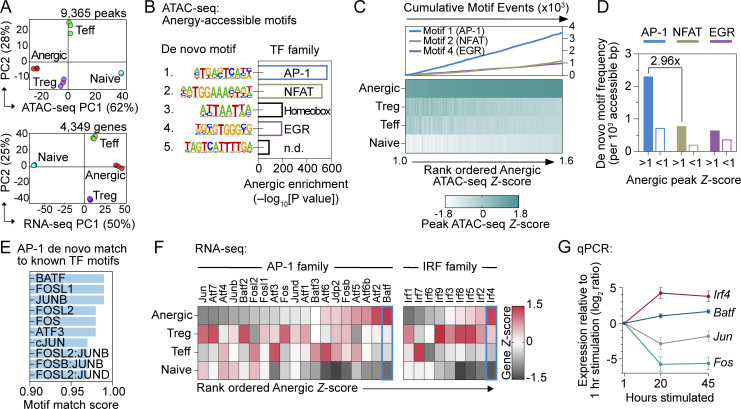
Anergic T cell chromatin is poised for an AP-1–driven transcriptional program. (A) PCA of chromatin accessibility (top; n = 9,365 differentially regulated ATAC-seq peaks) and mRNA expression (bottom; n = 4,349 differentially regulated genes) of physically sorted CD4+ T cell subsets from pooled spleen and lymph nodes (SLOs). CD44high Foxp3(GFP)− CD73high FR4high Nrp1+ Anergic (red), CD44high Foxp3(GFP)− CD73low FR4low Teff (green), Foxp3(GFP)+ CD25+ Treg (purple), and CD44low Foxp3(GFP)− naïve (blue). Percentages indicate the amount of variance explained within each of the first two PC dimensions. (B) De novo TF motifs were identified within the anergic ATAC-seq signature peaks (anergic Z-score >1; 3,320 peaks) in comparison to all other differentially accessible peaks (anergic Z-score <1; 6,045 peaks). n.d. = not determined. (C) Heatmap of sample group ATAC-seq relative DNA accessibility for 3,320 peaks with anergic Z-score >1 (bottom) and enumerated de novo TF motif (as indicated in panel) occurrences within the corresponding peak regions (top). (D) Anergy-associated de novo TF motif frequencies within binned ATAC-seq peaks, comparing anergic ATAC-seq signature peaks (anergic Z-score >1; 3,320 peaks) to all other differentially accessible peaks (anergic Z-score <1; 6,045 peaks). (E) Anergy-associated AP-1 de novo TF motif similarity to known TF consensus binding sequences. (F) Heatmap of relative RNA-seq expression for AP-1 (left) and IRF (right) family TFs. (G) Relative mRNA expression measured by qPCR following in vitro stimulation of naïve CD4+ T cells with anti-CD3 and anti-CD28 mAbs. Data are mean ± SD (n = 3 unique cell samples at each time point, two independent experiments). Source data for A–F: n = 3 samples for each group except n = 2 for naïve ATAC-seq; five pooled mice, one experiment.

