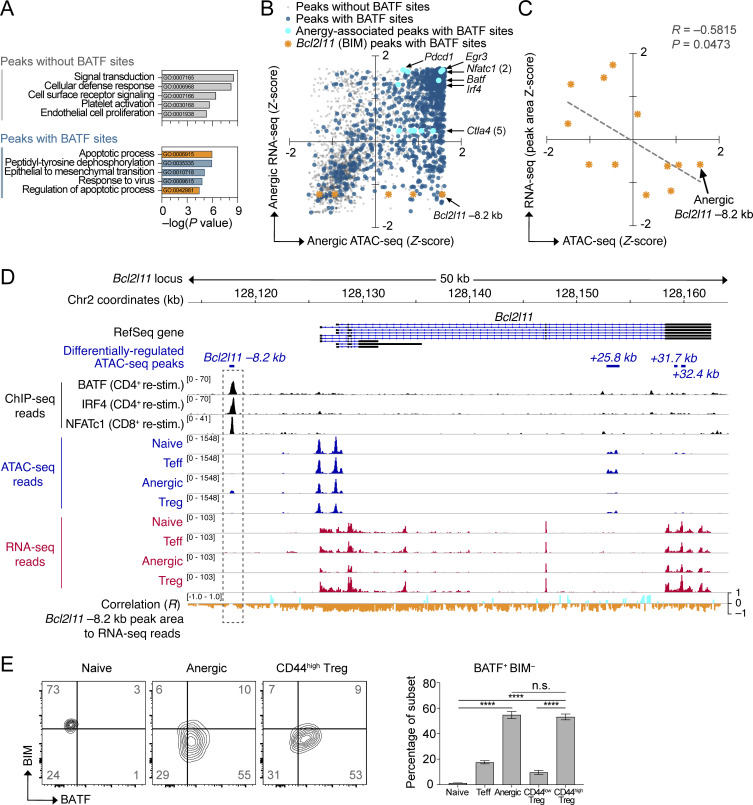
Figure 4.
Negative association between BATF and BIM (Bcl2l11) expression. (A) Pathway enrichment of genes near differentially regulated ATAC-seq peaks either lacking de novo BATF motifs (top) or containing BATF motifs (bottom). Analysis was performed on 3,746 unique peaks corresponding to a differentially expressed gene. The top five significant pathways for each group are displayed (database: GO Biological Process 2017). Pathways related to programmed cell death are shown in orange. (B) Integrated ATAC-seq and nearest neighbor RNA-seq mRNA expression data (3,746 total chromatin peaks) were plotted according to Z-scores within the anergic sample group. Peaks without BATF motifs (transparent gray; 995 peaks), peaks with BATF motifs (dark blue; 2,751 peaks), anergy-associated gene peaks containing BATF motifs (aqua highlight with annotation), and Bcl2l11 peaks with BATF motifs (orange highlight with annotation of predicted Bcl2l11 −8.2 kb repressor site). (C) Linear regression analysis of ATAC-seq read Z-score at 3 BATF-containing Bcl2l11 peaks versus the Z-scores for RNA-seq reads across the identical DNA peak coordinates. Data shown are pooled for all four sample groups at each of the three loci (naïve, Teff, anergic, Treg; n = 12 total points). Note that the three ATAC-seq peaks selected for analysis contained both a BATF consensus binding motif and also demonstrated increased chromatin accessibility in the Anergic sample group (lower right quadrant in B). (D) Stacked ChIP-seq, ATAC-seq, and RNA-seq tracks at the Bcl2l11 gene locus with the calculated correlation of transcriptional activity to the pattern of Bcl2l11 −8.2 kb peak reads (dashed rectangle highlight). Data tracks are as indicated (top to bottom): condensed RefSeq gene open-reading frames; differentially regulated ATAC-seq peak coordinates (relative to the putative transcriptional start site); BATF, IRF4, and NFATc1 ChIP-seq reads from published datasets of primed T cells receiving secondary stimulation (black; Iwata et al., 2017; Klein-Hessling et al., 2017); ATAC-seq mean read densities for each experimental group (blue); RNA-seq mean read densities for each experimental group (red); multivariate correlation plot between the Bcl2l11 −8.2 kb peak ATAC-seq reads versus RNA-seq reads at given coordinates across the locus (positive correlation = aqua, negative correlation = orange). (E) Flow cytometry plots of BATF versus BIM intracellular protein staining in WT polyclonal CD4+ T cell subsets (left; two concatenated samples per subset shown) and quantification (right; n = 18 mice, two independent experiments) of BATF+ BIM− cell percentages in the lower-right quadrant. The represented CD4+ T cell subsets were pre-gated using the antibody markers defined in Fig. 1. Numbers in the quadrants and right panel are mean percentages ± SD (one-way ANOVA with Tukey’s correction, ****P < 0.0001, n.s. = not significant). Source ATAC-seq and RNA-seq data for A–D as in Fig. 1.

