Figure 5.
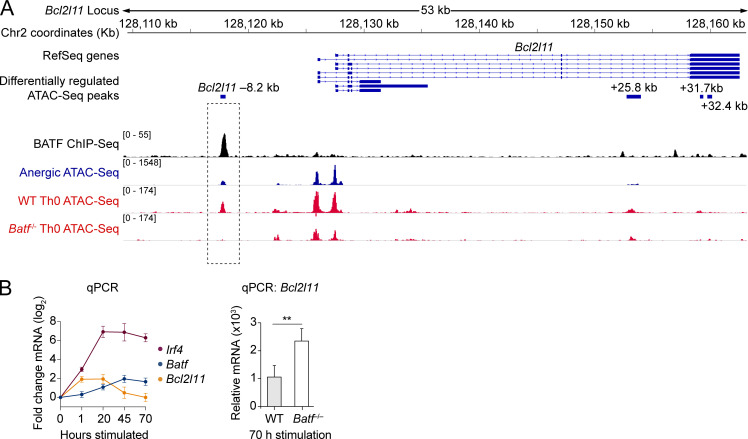
BATF-dependent chromatin remodeling at a putative DNA repressor element 8.2 kb upstream of the Bcl2l11 promoter. (A) Stacked ChIP-seq and ATAC-seq tracks at the Bcl2l11 gene locus with focus on the Bcl2l11 −8.2 kb peak (dashed rectangle highlight). Data tracks are as indicated (top to bottom): condensed RefSeq gene open-reading frames; differentially regulated ATAC-seq peak coordinates (relative to the putative transcriptional start site); BATF ChIP-seq reads (black; Iwata et al., 2017; Klein-Hessling et al., 2017); anergic group ATAC-seq reads (blue); ATAC-seq reads from 72 h in vitro CD3/CD28 mAb stimulated WT and Batf−/− CD4 T cells (red; Karwacz et al., 2017). Source ATAC-seq track data as in Fig. 1. (B) Relative mRNA expression measured by qPCR following in vitro stimulation of naïve CD4+ T cells with anti-CD3 and anti-CD28 mAbs. Left: Time course for Irf4, Batf, and Bcl2l11 relative mRNA levels in WT T cells. Data shown are the mean fold-change (log2) ± SD (n = 3 unique cell samples at each time point, two independent experiments). Right: Bcl2l11 mRNA observed in WT versus Batf−/− T cells after 70 h of stimulation. Data shown are the mean ± SEM (n = 6–7 samples in two independent experiments; unpaired t test; **P < 0.01).

