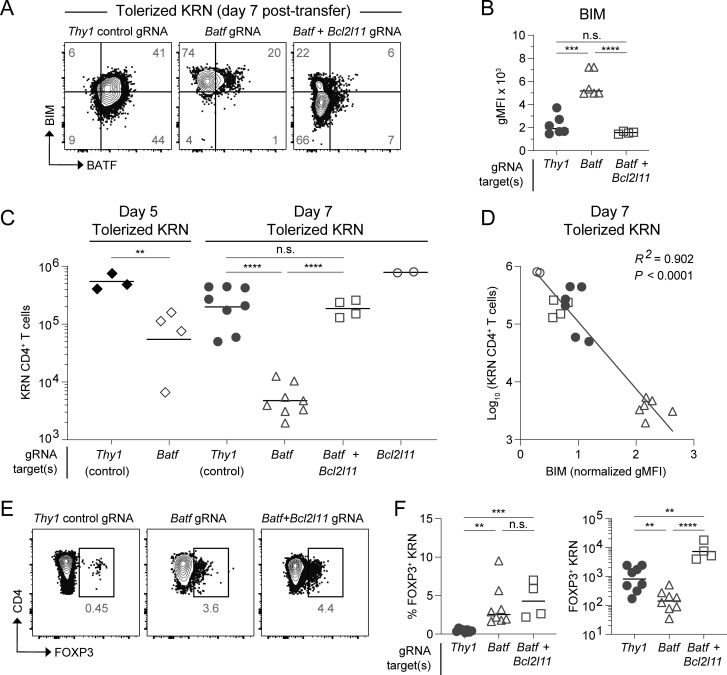
Figure 6.
BIM-dependent apoptosis of BATF-deficient T cells. CRISPR-Cas9 modified KRN transgenic T cells transferred into B6.I-Ab/g7 host mice and analyzed from the SLOs. Knockdown target(s) are indicated by the gRNA label. (A) BATF versus BIM intracellular protein staining 7 days after transfer. Numbers in the quadrants are mean percentages. Gating was set based on BATF and BIM expression in host-derived irrelevant naïve CD4 T cells (two concatenated samples shown). (B) gMFI of BIM protein in day 7 tolerized KRN T cells. Lines indicate the mean. (C) Total tolerized KRN T cell numbers recovered from B6.I-Ab/g7 host SLOs on days 5 and 7. Lines indicate the geometric mean. (D) Linear regression analysis of log-transformed total day 7 tolerized KRN T cell numbers versus sample-normalized BIM gMFI. Symbols correspond to day 7 experimental groups as in C (n = 18 total points from two independent experiments). (E) FOXP3 intracellular protein staining (two concatenated samples shown) 7 days after adoptive transfer. Numbers in the flow cytometry plots are mean percentages for the group among all samples. (F) Percentage (left) and total recovered cell numbers (right) of FOXP3+ KRN T cells 7 days after adoptive transfer. Lines indicate the mean (left) cell percentage or geometric mean (right) cell number. n = 2–8 mice per experimental group, four independent experiments (unpaired t test; **P < 0.01, ***P < 0.001, ****P < 0.0001, n.s. = not significant).

