Figure S3.
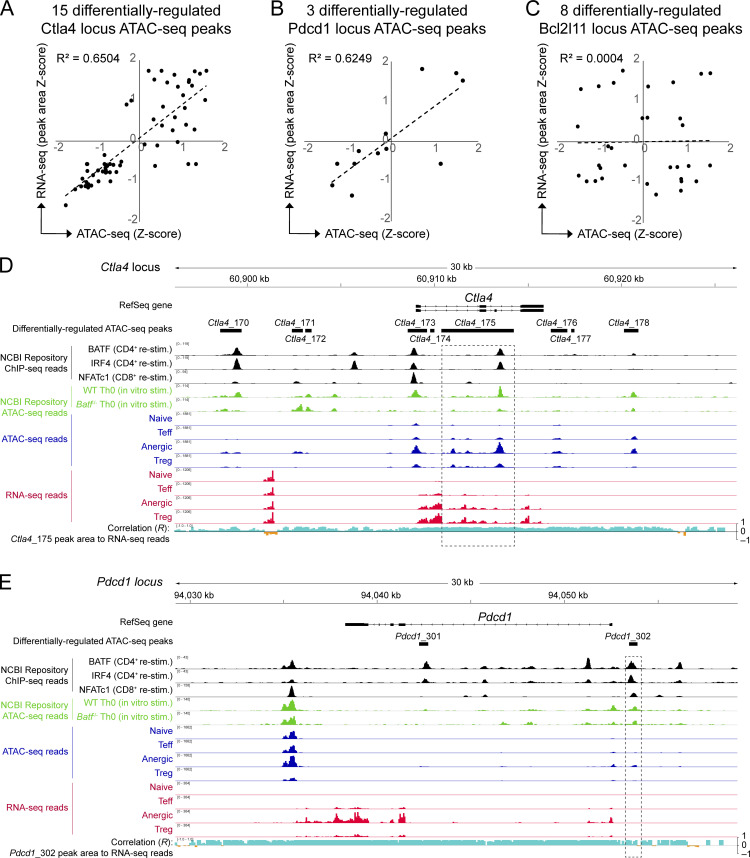
Tn5 transposase chromatin accessibility directly correlates with adjacent RNA transcriptional activity at the Ctla4 and Pdcd1 loci, but not at Bcl2l11. (A–C) Naïve, Teff, anergic, and Treg sample group Z-scores for both ATAC-seq chromatin accessibility and adjacent RNA-seq reads were calculated for the same ATAC-seq peak sequence coordinates and compared, with correlation coefficients (R2) as shown. Correlation is shown for (A) 15 differentially regulated Ctla4 locus peaks (Ctla4_166 through Ctla4_180), (B) three differentially regulated Pdcd1 locus peaks (Pdcd1_301 through Pdcd1_303), and (C) eight differentially regulated Bcl2l11 locus peaks (Bcl2l11_5387 through Bcl2l11_5394). Note that the Bcl2l11_5390 ATAC-seq peak is referred to as “Bcl2l11 −8.2 kb” in Figs. 4 and 5 as well as in the text. (D and E) Ctla4 (D) and Pdcd1 (E) loci are displayed using the Integrated Genomics Viewer. Data tracks are as indicated (top to bottom): Condensed Refseq gene open-reading frames; differentially regulated ATAC-seq peak coordinates; BATF, IRF4, and NFATc1 ChIP-seq DNA-binding from published datasets (black); published ATAC-seq mean read densities for in vitro stimulated WT and Batf−/− Th0 cells (green); ATAC-seq mean read densities for each experimental group (blue); RNA-seq mean read densities for each experimental group (red); plot of multivariate correlation observed between locus RNA-seq reads and one nearby BATF-binding ATAC-seq chromatin accessibility peak (Ctla4_175 in D; Pdcd1_302 in E; intervals highlighted in dashed rectangles) with positive correlation shown in aqua and negative correlation in orange. Source ATAC-seq and RNA-seq data as in Fig. 1.

