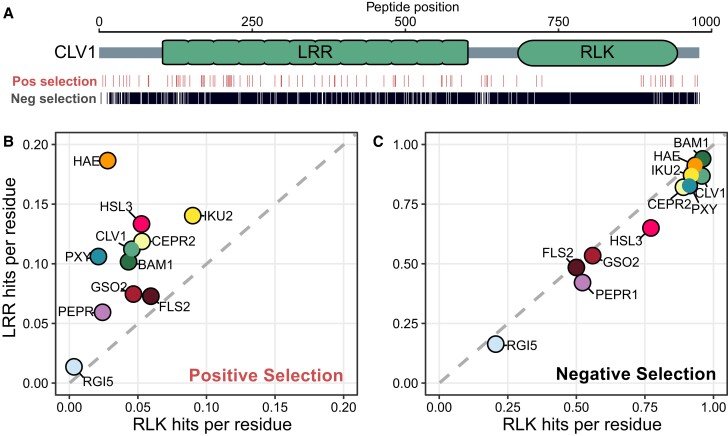
Fig. 2.
Signatures of selection are unequally distributed between LRR and RLK domains. a) CLV1, as an example, with the locations of sites predicted to be under positive or negative selection shown. b) Rates per residue of signatures of positive selection in RLK (x-axis) versus LRR (y-axis) domains in each clade. c) Rates per residue of signatures of negative selection in RLK (x-axis) versus LRR (y-axis) domains in each clade. Gray dashed line defines the region of no ratiometric bias between domains.

