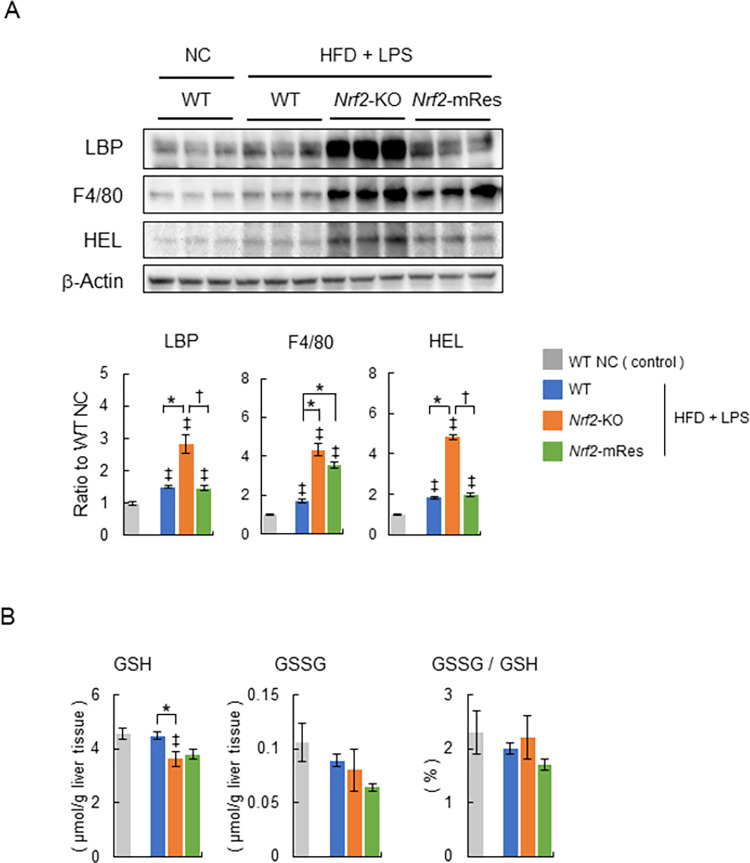
Fig 5. The expression of Nrf2 in macrophages recovers the clearance of LPS and does not affect the infiltration of Kupffer cells in a mouse model of NASH.
(A) Representative immunoblots of LPS-binding protein (LBP), F4/80, hexanoyl lysine (HEL), and β-actin in liver tissues from wild-type (WT), Nrf2-KO, and Nrf2-mRes mice fed normal chow, or an HFD and administered lipopolysaccharide (LPS) from Porphyromonas gingivalis (P.g.) (n = 5–6/group). Bar graphs in the right panel show the quantitation of the optical density of the immunoblots. (B) Glutathione (GSH), glutathione disulfide (GSSG) concentrations, and the percentage of GSSG/GSH in the livers of WT, Nrf2-KO, and Nrf2-mRes mice fed normal chow, or an HFD and administered LPS from P.g. (n = 5–6/group). Values are the mean ± SEM. ‡P < 0.05, WT NC vs. HFD + LPS groups, *P < 0.05, WT vs. Nrf2-KO or Nrf2-mRes in HFD + LPS groups, †P < 0.05, Nrf2-KO vs. Nrf2-mRes in HFD + LPS groups.

