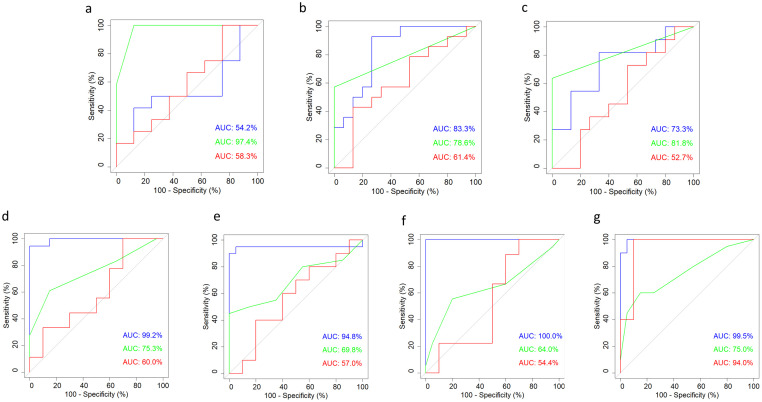
Fig 2. Receiver operating curve (ROC) analyses.
The area under the curve (AUC) was computed for each parameter. The following parameters—illustrated by different colors as indicated below—were subjected to ROC analyses across all projects: Distance moved in the open field test (blue), Irwin sum score (green), and saccharin preference (red). (a) intrahippocampal kainate model, (b) amygdala-kindling model, (c) hippocampal-kindling model, (d) Gria1 model: early adolescence, (e) Scn1a model: early adolescence; (f) Gria1 model: late adolescence, (g) Scn1a model: late adolescence. The raw data underlying this figure are available in the Figshare repository https://doi.org/10.6084/m9.figshare.22759148.v1.

