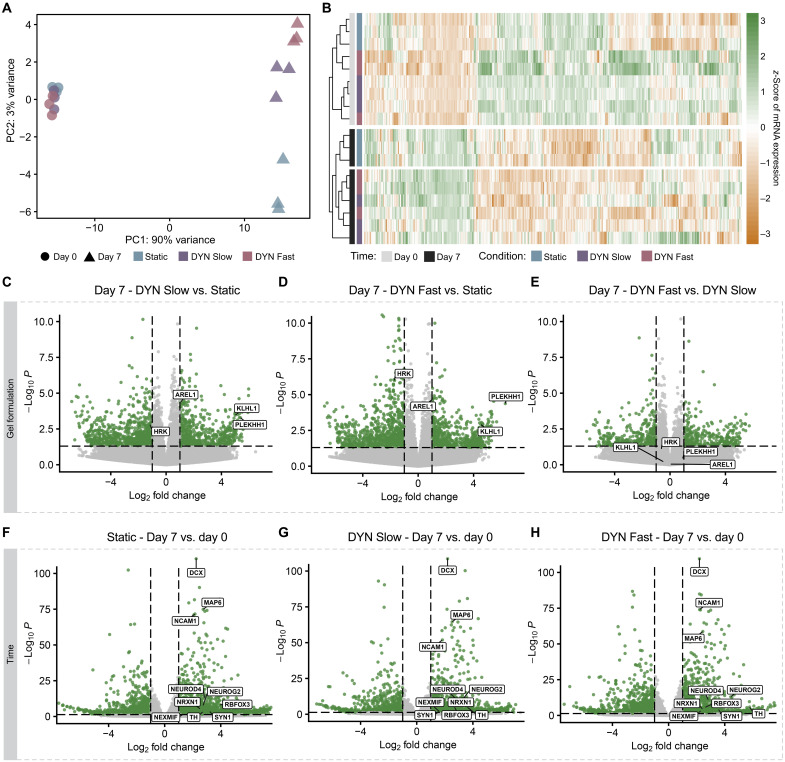
Fig. 3. Transcriptional differences emerge in hNPCs across time and hydrogel relaxation rate.
(A) Principal components analysis of normalized count data reveals that hNPCs encapsulated at 3 × 10⁴ cells/μl within hydrogels cluster first by time and second, after 7 days of culture, by gel formulation (N = 3 replicate hydrogels). Axes represent the first two principal components (PC1 and PC2). (B) Heatmap of gene expression represented as z-scores for the top 500 differentially expressed genes as identified with DESeq2. Counts were normalized and scaled across columns. (C to H) Volcano plots showing P value and fold change for hNPCs encapsulated within the stated hydrogel condition and time point. Differentially expressed genes (fold change ≥ 1, adjusted P < 0.05 with false discovery rate) are depicted in green. (C to E) Pairwise comparisons between all three gel conditions at day 7 converge on genes associated with apoptosis (HRK and AREL1) and cytoskeletal dynamics (KLHL1 and PLEKHH1). (F to H) Pairwise comparisons across the day 0 and day 7 time points for each gel condition. Genes associated with neurogenesis are labeled.

