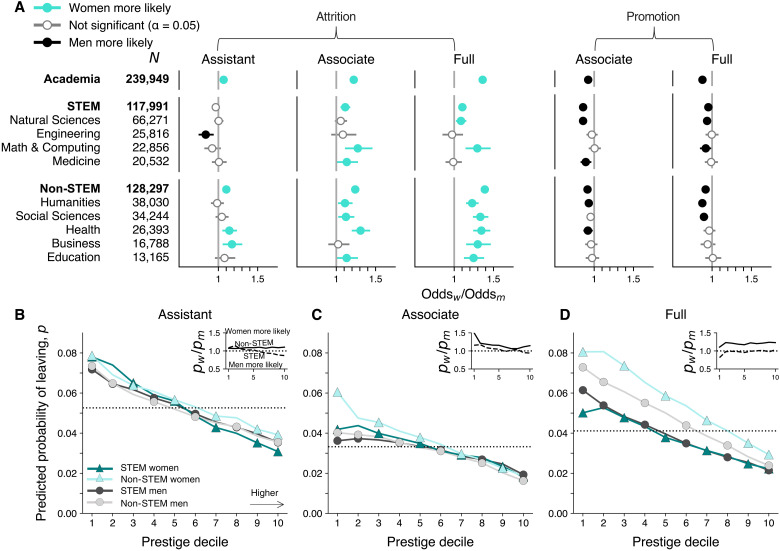
Fig. 2. Retention rates by domain and prestige.
(A) Time-averaged attrition and promotion ORs, split by academic rank, controlling for career length, employer prestige, and doctoral degree (domestic versus international), with 95% confidence intervals and statistical significance assessed via a z test. Because our dataset is a census, error bars can be interpreted as reflecting variability primarily from the underlying mechanisms rather than uncertainty in the odds that we observe. Individuals with appointments in multiple domains (12.8% of faculty) are counted in each domain. Contrasting Fig. 1, here, faculty without PhD country or employer prestige information were excluded. (B to D) Average predicted probability of leaving, split by academic rank and across prestige decile, with 10 representing the most prestigious and 1 the least prestigious employer, for women and men in STEM versus non-STEM domains. Dotted horizontal lines represent the average probability of leaving for all professors at that rank. Inset: pwomen/pmen across prestige decile, for STEM (dashed) versus non-STEM (solid) domains.

