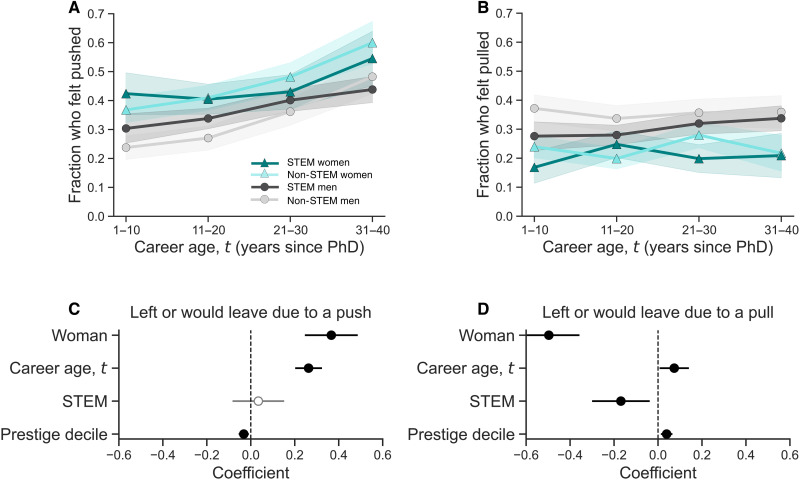
Fig. 3. Pushes and pulls.
Fraction of women and men in STEM versus non-STEM domains across career age who left or would leave their position because (A) they felt pushed out of their position or (B) they felt pulled toward a better position. Envelopes indicate a 95% confidence interval using a normal approximation to a binomial proportion. Coefficients from logistic regression models predicting whether someone felt (C) pushed or (D) pulled.

