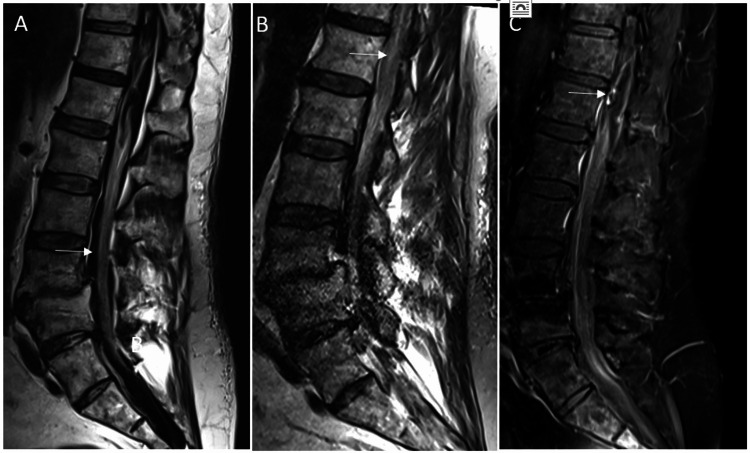
Figure 7. Sagittal MRI images from case three.
(A) T2 sequence showing the intradural hematoma (white arrow); (B) T2 sequence showing hyperintensity at the conus, consistent with a possible infarct (white arrow); (C) T1 post-contrast sequence showing abnormal enhancement in the ventral spinal canal (white arrow).

