. 2023 Sep 18;12:e85756. doi: 10.7554/eLife.85756

Figure 3. Connectivity of UpWind Neurons (UpWiNs).

(A) The expression pattern of CsChrimson-mVenus driven by split-GAL4 line SS33917. The scale bar is 20um. The insert image shows signals of membrane reporter myr-smHA and presynaptic reporter Syt-smV5 driven by the same driver. (B) Eleven EM-reconstructed neurons that correspond to UpWiNs defined by the SS33917 driver were identified by analyzing the morphology of individual neurons (Figure 3—figure supplements 1 and 2) and are displayed with outline of the MB and the standard brain. Individual neurons are color-coded to indicate the cell type to which they were assigned. (C) Connectivity of UpWiNs with major upstream and downstream neurons that have at least 20 connections with 1 of the 11 UpWiNs. The hemibrain body IDs of each neuron is shown as well as their assignment to specific cell types. Numbers indicate the number of synapses from the upstream neurons to UpWin neurons (left) or from the UpWiNs to the downstream neurons (right). (D) Interneurons downstream to mushroom body output neuron (MBON)-α1 and MBON-α3. Colors of dots indicate neurotransmitter prediction (Eckstein et al., 2020). See Figure 3—figure supplement 3 for more details. (E) Predicted postsynaptic sites in SMP353 and SMP354 (gray), which are juxtaposed to presynaptic sites from MBON-α1 (green) and MBON-α3 (orange). The insert (10 μm width) shows a magnified view of juxstaposed synapses. (F) Interconnectivity between UpWiNs. The numbers indicate the summed number of connections. The numbers in parentheses indicate the number of neurons per cell type.

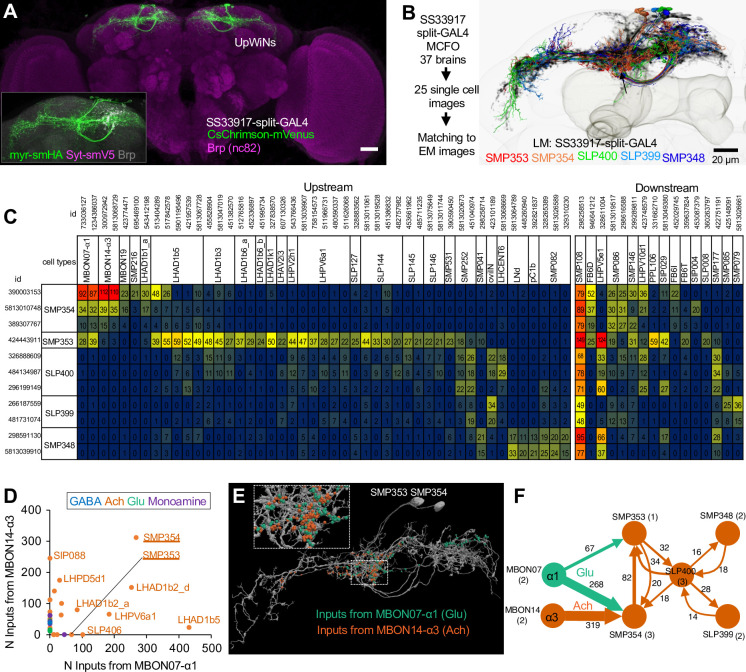
Figure 3.

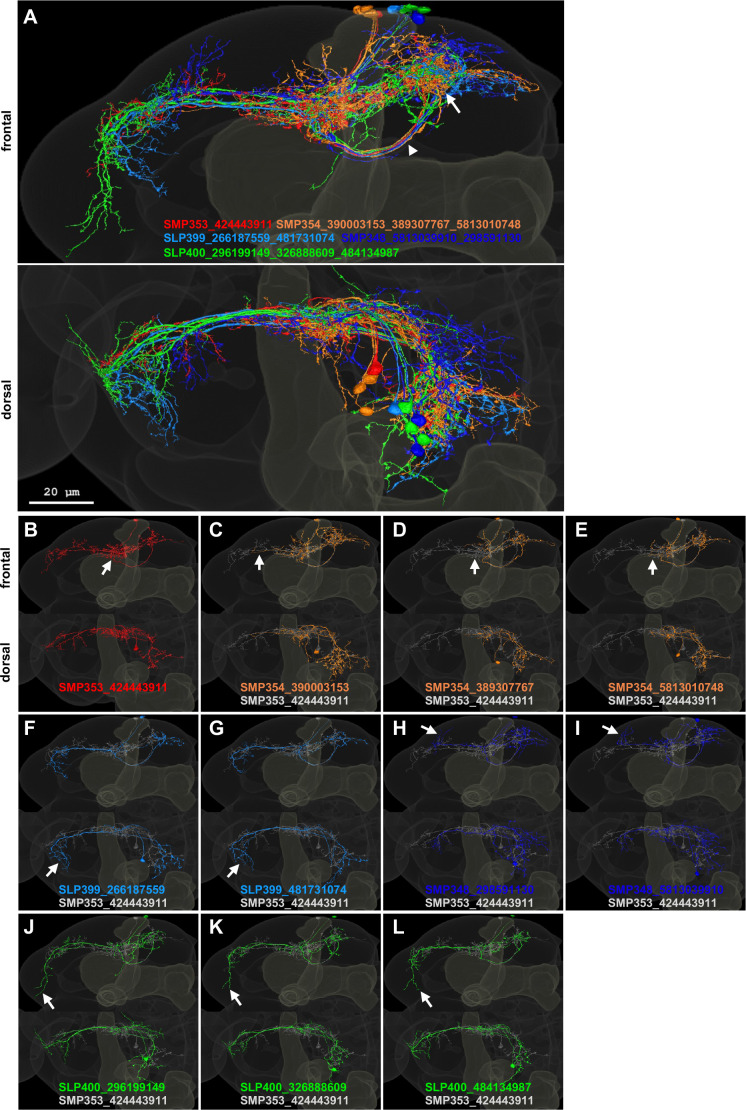
Figure 3—figure supplement 1. Candidate UpWind Neurons (UpWiNs) in hemibrain EM images.

Figure 3—figure supplement 1.

(A) Frontal and dorsal projection of 11 EM-reconstructed neurons that were matched with confocal images of UpWiNs within the standard brain (Bogovic et al., 2020) (see Figure 3—figure supplement 2). Pseudo colors were assigned to each of five cell types. The arrowhead and arrow indicate common axonal tract and terminal area in the SMP. IDs of each neuron are displayed. The somas of these neurons are clustered near the tip of the vertical lobe of the MB, and they share the tracts for the primary neurite and axons, whereas the branching patterns of their dendrites exhibit cell-type-specific characteristics, which were used for cell-type matching. (B–L) Projections of individual neurons. The arrows indicate dendritic branches that are characteristic to each cell type.
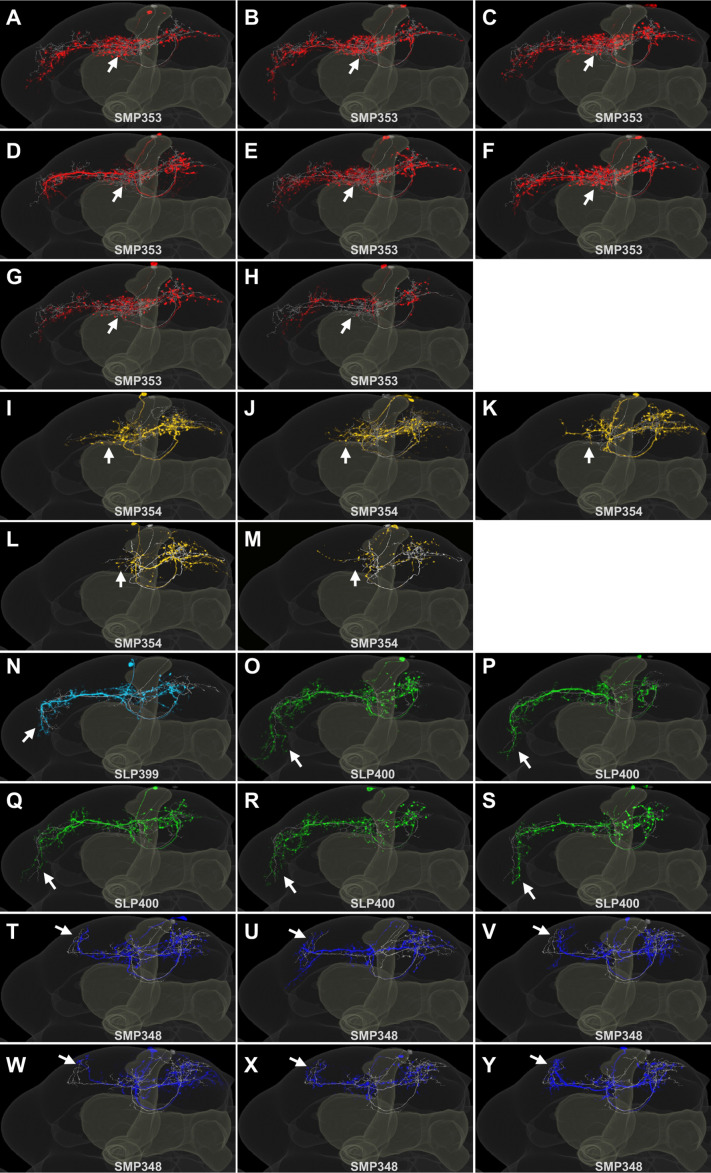
Figure 3—figure supplement 2. Single cell images of neurons in SS33917.

Figure 3—figure supplement 2.

(A–Y) Frontal projections of segmented multi-color flip-out images of SS33917 (colored) with corresponding EM neuron (gray). The arrows indicate dendritic branches that are characteristic to each cell type.
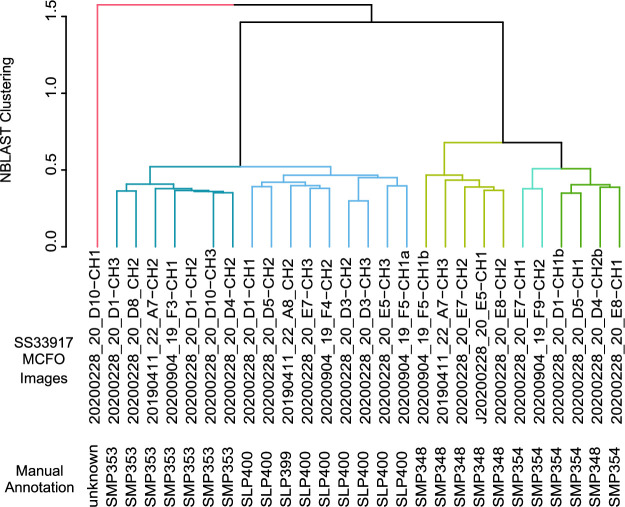
Figure 3—figure supplement 3. NBLAST clustering of single cell images of neurons in SS33917.

Figure 3—figure supplement 3.

Multi-color flip-out (MCFO) single cell images of SS33917 driver were clustered into six groups, which were nearly identical to the manual annotation.
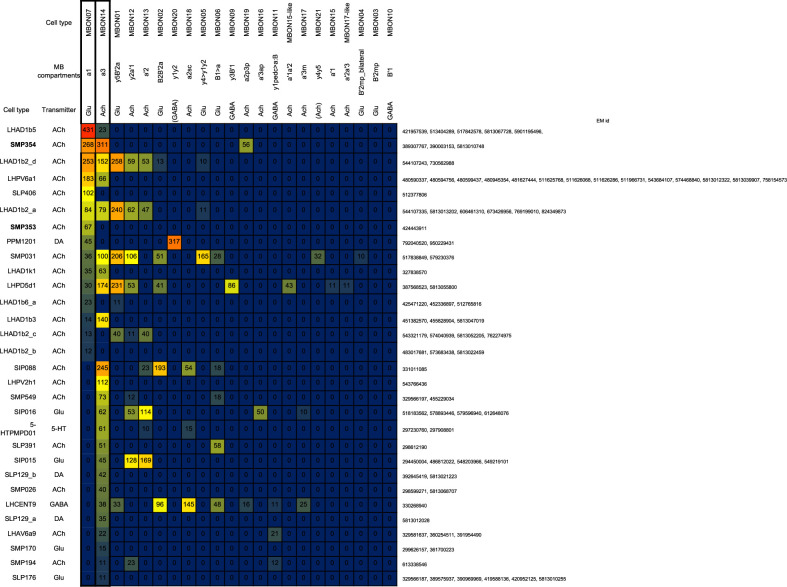
Figure 3—figure supplement 4. Downstream neurons of mushroom body output neuron (MBON)-α1 and MBON-α3.

Figure 3—figure supplement 4.

Connectivity from MBON-α1 and MBON-α3 to downstream neurons that receive at least 10 connections.