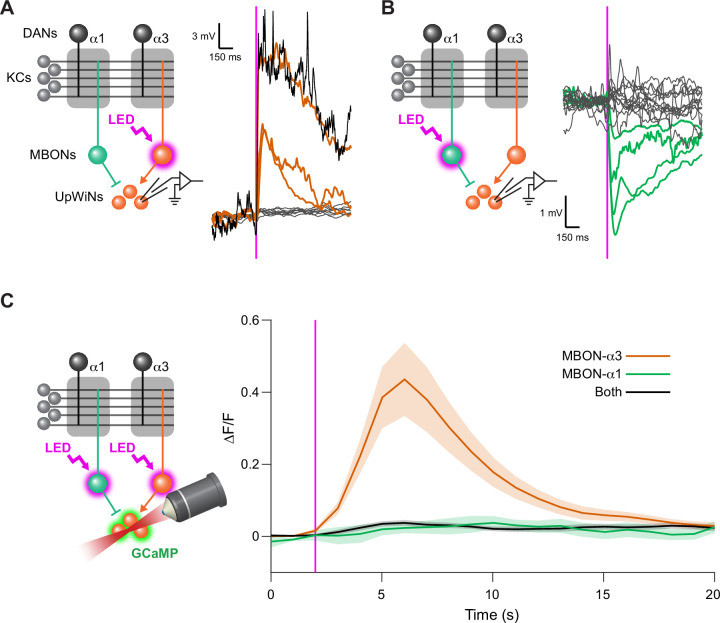
Figure 4. UpWind Neurons (UpWiNs) integrate excitatory and inhibitory synaptic inputs from mushroom body output neurons (MBONs).
(A) Functional connectivity between MBON-α3 and UpWiNs. Chrimson88-tdTomato was expressed in MBON-α3 by MB082C split-GAL4, and the photostimulation responses were measured by whole-cell current-clamp recording in randomly selected UpWiNs labeled by R64A11-LexA. 3 out of 11 neurons (7 flies) showed excitatory response. Mean voltage traces from individual connected (orange) and unconnected UpWiNs (gray) are overlaid. The connection was strong enough to elicit spikes (black; single-trial response in one of the connected UpWiNs). Magenta vertical line indicates photostimulation (10 ms). (B) Functional connectivity between MBON-α1 and UpWiNs. Chrimson88-tdTomato expression in MBON-α1 was driven by MB310C split-GAL4. 4 out of 17 neurons (12 flies) showed inhibitory response. Mean voltage traces from individual connected (green) and unconnected UpWiNs (gray) are overlaid. (C) Integration of synaptic inputs from MBON-α3 and MBON-α1. Population responses of UpWiNs were measured by two-photon calcium imaging at the junction between dendrites and axonal tracts (mean ∆F/F ± SEM) while photostimulating MBON-α3 (orange; n=5), MBON-α1 (green; n=11) or both (black; n=7). Expression of GCaMP6s was driven by R64A11-LexA, and Chrimson88-tdTomato by G0239-GAL4 (MBON-α3) and/or MB310C (MBON-α1). Photostimulation: 1 s (magenta). While activation of MBON-α1 did not evoke detectable inhibition in the calcium signal, it effectively canceled the excitation by MBON-α3.


