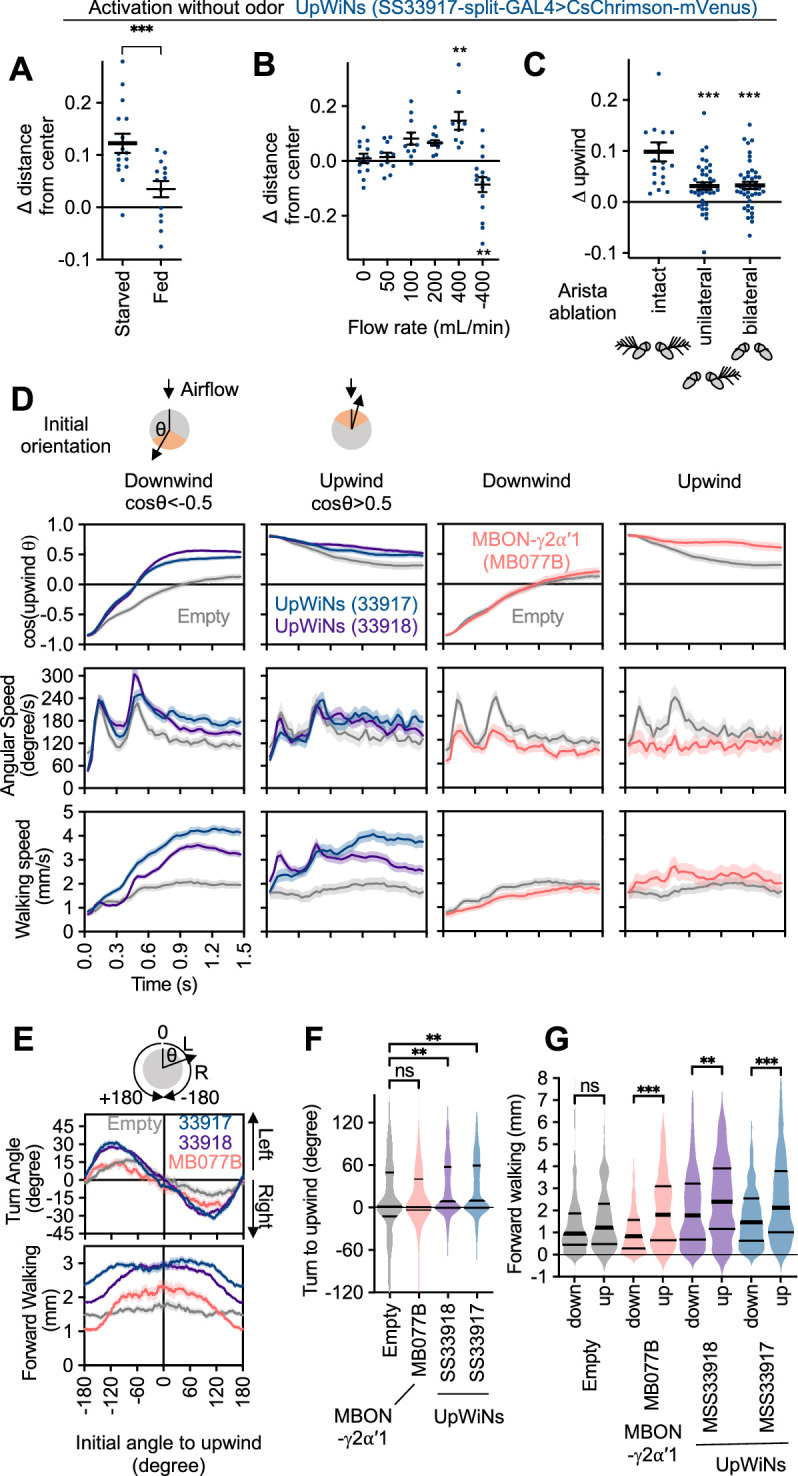
Figure 6. Activity of UpWind Neurons (UpWiNs) bias turning direction.
(A) Fed or 40–48 hr starved flies were compared to assess requirement of starved status for UpWiNs to promote upwind locomotion. n=14 (fed) and 16 (starved); ***, p<0.001, Mann-Whitney test. (B) Upwind locomotion during the 10 s activation of UpWiNs in the arena with various rates of airflow. n=9–16;**, p<0.01; Dunn’s multiple comparison tests compared to the zero flow condition. (C) Right side or both sides of aristae were ablated 1 day prior to experiments to measure upwind response during UpWiN activation. n=20 (intact) and 40 (unilateral and bilateral); ***, p<0.001; Dunn’s multiple comparison tests compared to the intact control. (D) Behavioral kinematics of UpWiN activation. The trajectories of individual flies during first 1.5 s of 10 s LED period were grouped to initially facing downwind or upwind if cos(upwind angle) was above 0.5 or below –0.5, respectively. (E) Cumulative angle of turning and forward walking speed during the first 10 frames (333 ms) after the onset of LED plotted against initial angle to upwind smoothened with ±30 degree bin. The number of trajectories analyzed for (SS33917, SS33918, MB077B, empty-split-GAL4) were (2492, 3362, 772, 1582), respectively. Only flies that were at least 3 mm away from the edge of the arena were analyzed. (F–G) The violin-plots of the cumulative angle of turn to the upwind orientation or forward walking speed during the first 10 frames (333 ms) of odor onset. Only flies that oriented –90 to –150 or +90–150 degrees to upwind at the odor onset were analyzed. n=444, 540, 231, 219 for SS33917, SS33918, MB077B, empty-split-GAL4, respectively. **, p<0.01; ***, p<0.001; Dunn’s multiple comparison for the selected pairs, following Kruskal-Wallis test. Thick and thin horizontal lines are mean and SEM in (A–C) and median and quartile ranges in (F–G), respectively.


