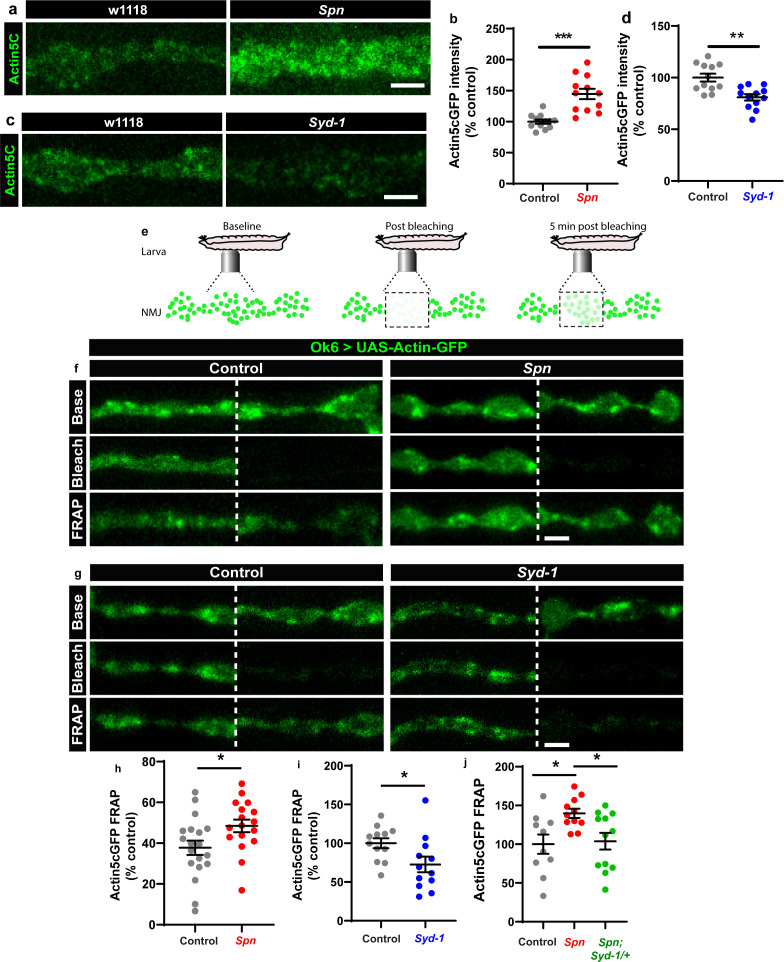
Figure 4. The Spinophilin/Syd-1 antagonism converges on presynaptic F-actin dynamics.
(a,c) Representative images of third-instar larval muscle 4 NMJs showing intrinsic Actin-GFP. Scale bars: 2 µm. (a–d) Spn mutants show an increase in Actin-GFP intensity while Syd-1 mutants show a decrease compared to controls. (b,d) mean actin-GFP intensities measured through confocal imaging. (e) Scheme depicting in vivo fluorescence recovery after photobleaching (FRAP) imaging procedure at developing Drosophila larval NMJs at baseline (before photobleaching), immediately post bleaching and then again after 5min to track recovery of fluorescently labelled protein. (f–g) Representative images of muscle 26/27 NMJs labelled with Actin5CGFP. Quantification of FRAP shows Actin5CGFP at the NMJ (h) increase in Spn mutants, (i) decrease in Syd-1 mutants and (j) a rescue of Spn mutant phenotype on removal of a single gene copy of Syd-1 (Spn,Syd-1/+). Also see Figure 4—figure supplement 1. Source data as exact normalized and raw values, detailed statistics including sample sizes and p values are provided in Figure 4—source data 1. *p ≤ 0.05; **p ≤ 0.01; ***p ≤ 0.001; n.s., not significant, p > 0.05. All panels show mean ± s.e.m.


