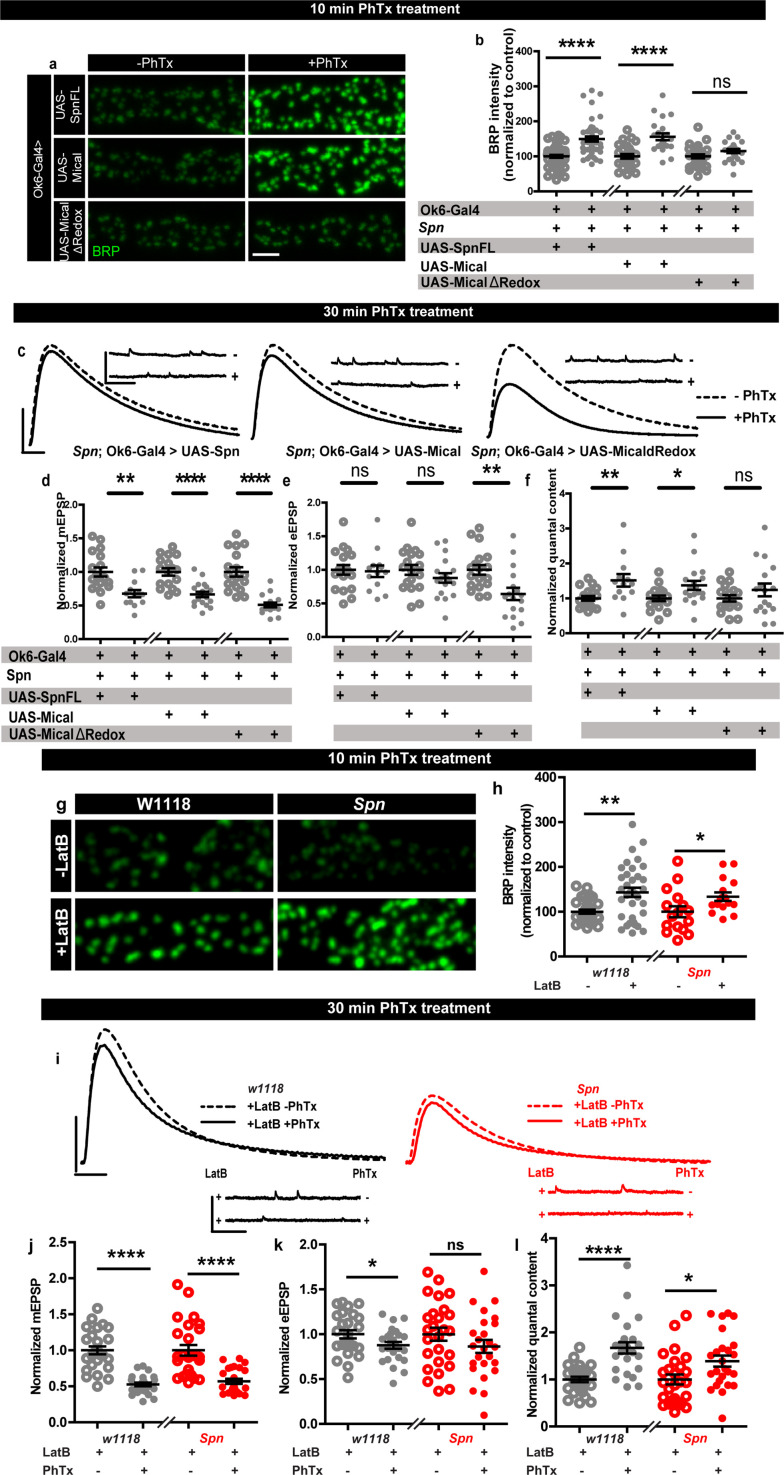
Figure 5. Rescue of Spinophilin plasticity deficits after genetic and pharmacological disruption of F-actin.
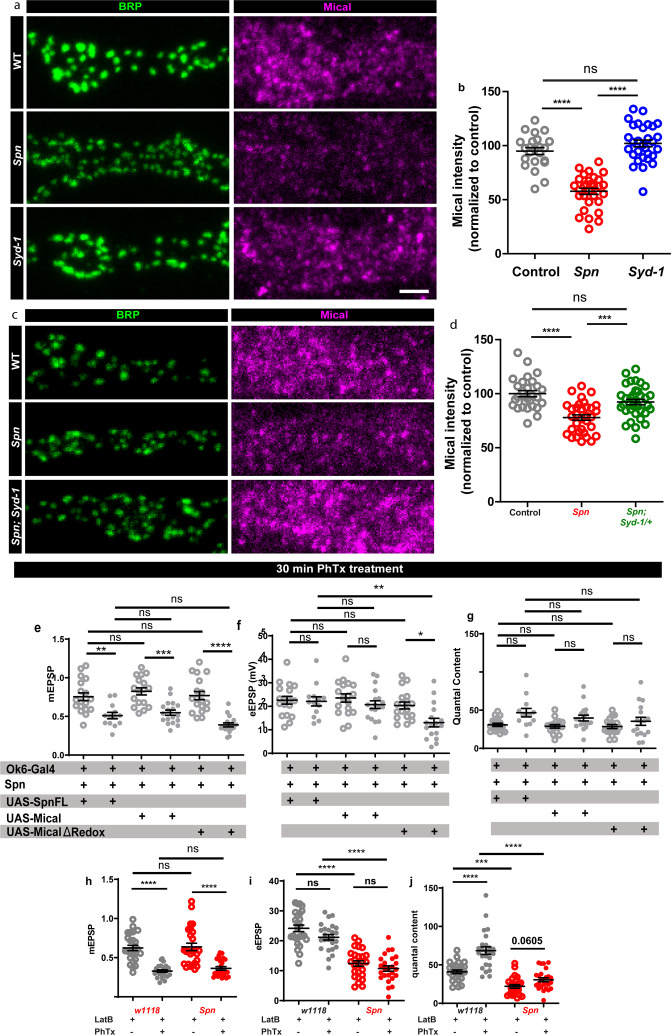
(a,g) Representative images of third-instar larval muscle 4 NMJs immunostained with an antibody against BRP. Scale bars: 2 µm. (a–b) motoneuronal expression of full-length Spn and Mical in Spn mutant background reinstates BRP increase upon PhTx treatment, while MicalΔRedox expression does not. (g–h) Latrunculin-B (LatB) treatment results in an increase in BRP in both control and Spn mutants. (B,H) mean BRP intensities measured through confocal imaging. (c,i) Representative traces of mEJP and eEJP measurements at third-instar larval muscle 6/7 NMJs. Scale bars: eEJP, 10ms, 10 mV; mEJP traces 500ms, 5 mV. (d,j) mEJP amplitudes are reduced upon PhTx treatment. eEJP amplitudes are compensated (e) and QC is increased (f) in motoneuronal expression of full-length Spn and Mical in Spn mutant background upon 30 min PhTx treatment but not in MicalΔRedox. eEJP amplitudes are compensated (k) and QC is increased (l) in control animals and Spn mutants treated with LatB. Also see Figure 5—figure supplement 1. Source data as exact normalized and raw values, detailed statistics including sample sizes and p values are provided in Figure 5—source data 1. *p≤0.05; **p ≤ 0.01; ***p ≤ 0.001; n.s., not significant, p > 0.05. All panels show mean ± s.e.m.


