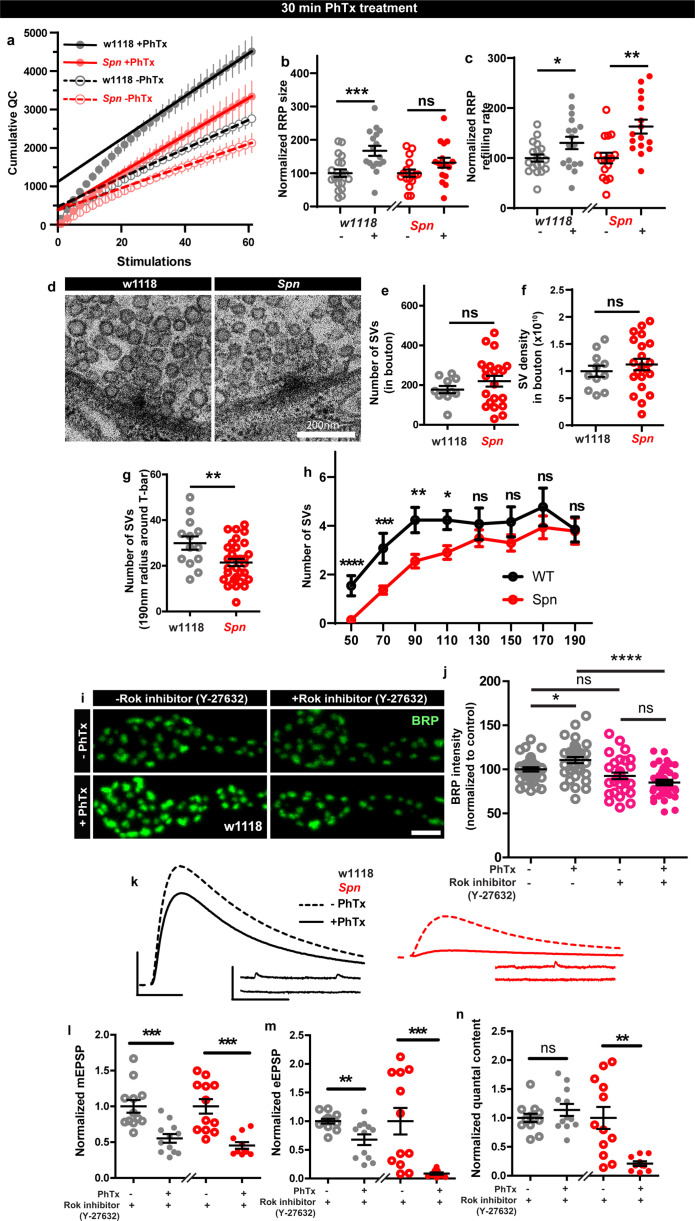
Figure 6. Spinophilin facilitates plastic increases in release-ready vesicle pool size.
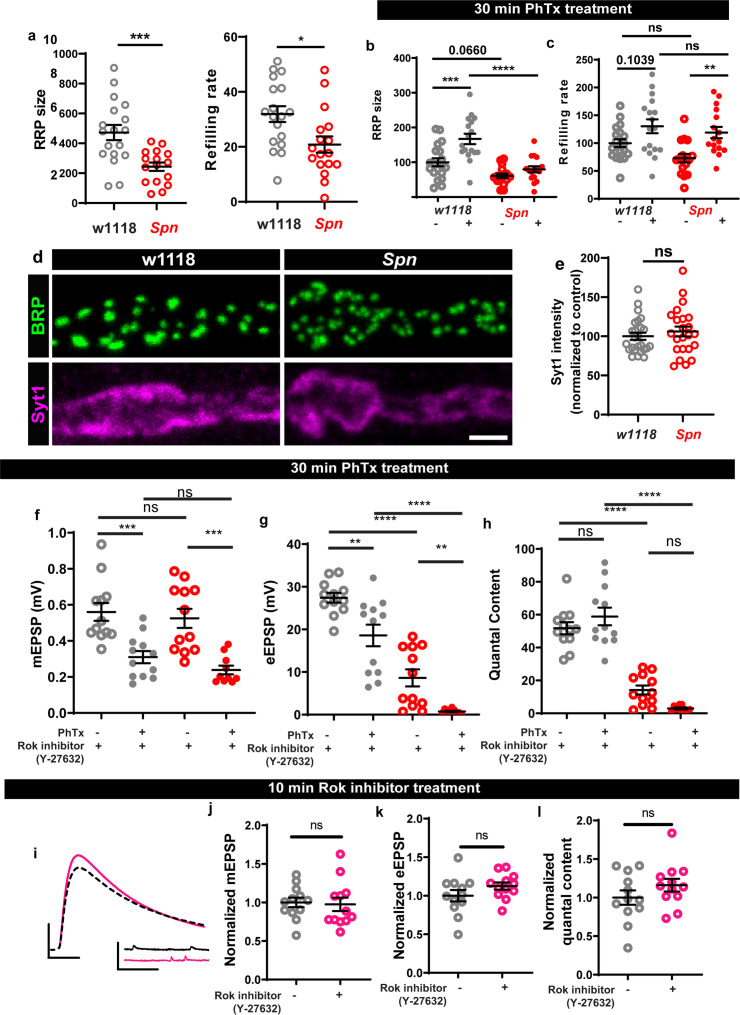
Quantification of the RRP size (b) and RRP refilling rate (c) from (a) Average cumulative quantal content plotted against the number of stimulations with linear regression of the steady state amplitudes. (d) Representative electron microscopy images of control showing normal SV distribution and Spn mutants showing sparse SV distribution around the AZ T-bar. Spn mutants have a normal number of SVs in the bouton quantified in (e) absolute number of SVs and (f) SV density in bouton, but have (g) fewer SVs in the vicinity of the AZs. (h) SVs distribution at increasing distance from the center of the AZ shows that Spn mutants have fewer SVs near the AZ center, but have normal numbers of SVs further away from the AZ center. (i) Representative images of third-instar larval muscle 4 NMJs immunostained with an antibody against BRP. Scale bars: 2 µm. (j) Preincubating larvae with Rok inhibitor results in their inability to upregulate BRP upon PhTx treatment. (k) Representative traces of mEJP and eEJP measurements at third-instar larval muscle 6/7 NMJs. Scale bars: eEJP, 10ms, 10 mV; mEJP traces 500ms, 5 mV. (l) mEJP amplitudes are reduced upommican PhTx treatment. Upon PhTx treatment, eEJP amplitudes are not compensated (m) and QC does not increase (n) in Rok-inhibitor treated controls and Spn mutants. Also see Figure 6—figure supplement 1. Source data as exact normalized and raw values, detailed statistics including sample sizes and p values are provided in Figure 6—source data 1. *p≤0.05; **p ≤ 0.01; ***p ≤ 0.001; n.s., not significant, p > 0.05. All panels show mean ± s.e.m.


