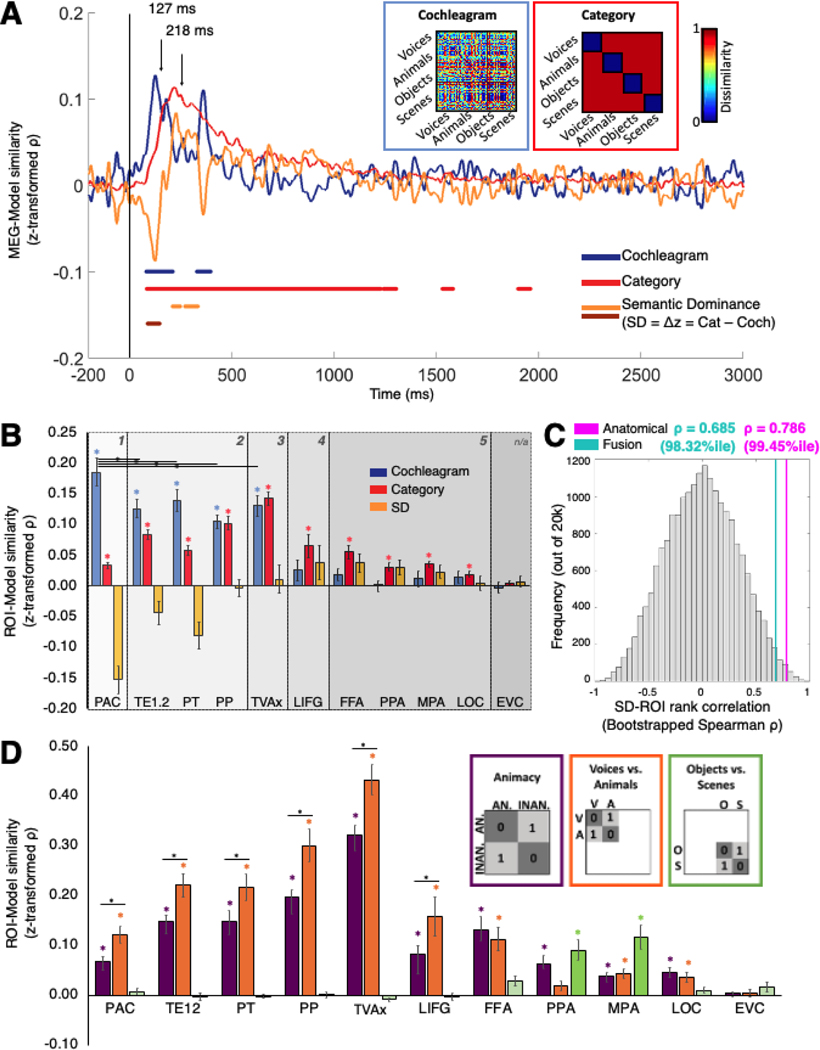
Figure 3: Emerging category vs. acoustic selectivity across time and ROIs.
A. Temporal dynamics in MEG responses: Cochleagram (blue) and Category (red) model RDMs shown in insets encode hypothesized similarity structures of acoustic and semantic neural stimulus representations. Pairwise Cochleagram model dissimilarities are indexed by the euclidean distance between stimulus log-frequency spectra; for the Category model, all between-category pairs were assigned a value of 1 and within-category pairs a value of 0. Plot shows Fisher z-normalized correlation time courses between models and whole-brain MEG data. Cochleagram and Category peaks at 127 (CI 119–178) ms and 217 (CI 209–259) ms, respectively. Yellow trace is Semantic Dominance (SD) difference score, Δz = zCategory – zCochleagram. Negative SD = acoustically dominated responses; positive SD = semantic category-dominated responses. Color-coded bars indicate significant temporal clusters for each trace (dark bar is significantly negative SD, i.e. significantly stronger Cochleagram vs. Category model correlation). B. Model correlations with RDMs computed from fMRI ROI data. Color code same as in A. Bar plots depict the subject-averaged measure in each ROI; error bars = standard error of the mean (SEM). Numbered gray-shaded partitions indicate ranks assigned to ROIs according to anatomical position. Color-matched asterisks indicate significantly positive correlation; black horizontal bars and bisecting asterisks indicate significant correlation differences between pairs of STG ROIs. C. Histogram of 20,000 bootstrapped ROI-SD trend rank correlations compared with empirical correlations from our anatomical (magenta; 99.5%ile) and fusion-derived (cyan; 98.3%ile) ROI rank assignments. D. Semantic subcategory distinctions in fMRI ROIs. Subject-averaged bar plots indicate distinction between category animacy (purple), human vs. animal vocalizations (orange), and objects vs. scenes (green). Plotting conventions and statistics same as in B. Black horizontal bars and bisecting asterisks indicate significant correlation differences between models within STG/IFG ROIs. Bonferroni corrected one-tailed t-tests, asterisks indicate significance at p < 0.05.

