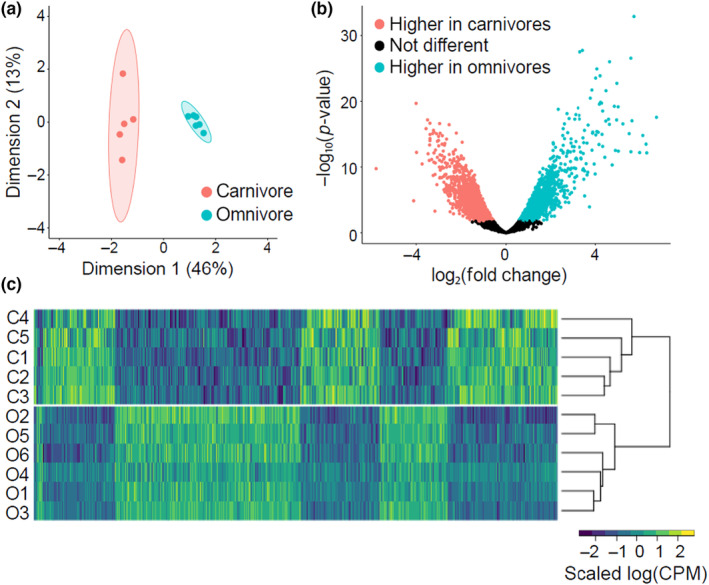
FIGURE 2.

Gene expression patterns within Spea multiplicata tadpoles. (a) Multidimensional scaling plots of log2‐counts‐per‐million along the first dimensions. (b) Volcano plot of RNA‐seq data at the Trinity “gene” level, where differentially expressed genes with q < 0.05 are statistically significant. (c) Heat map of log2 counts‐per‐millions for transcripts that show statistically‐significant differential expression between carnivores and omnivores. Carnivore samples are labeled with C1 through C5, omnivore samples are labeled from O1 through O6.
