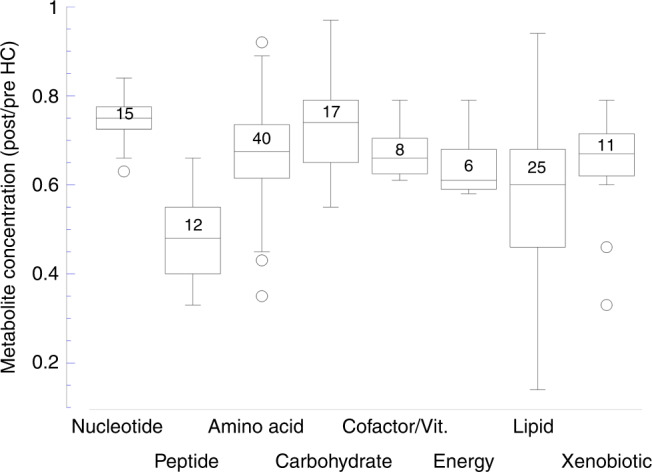
Fig. 3. HC suppression in post/pre analysis of named metabolites by Super Pathway assignment.

Box plots with number of suppressed metabolites in each pathway. Significance between pathways by ANOVA with Tukey’s HSD: nucleotide vs lipid p = 0.0008, peptide vs amino acid p = 0.0003, peptide vs cofactor/vitamin p = 0.022, carbohydrate vs lipid p = 0.003. HC suppresses metabolites in each of 8 Super Pathways with significant differences in magnitude.
