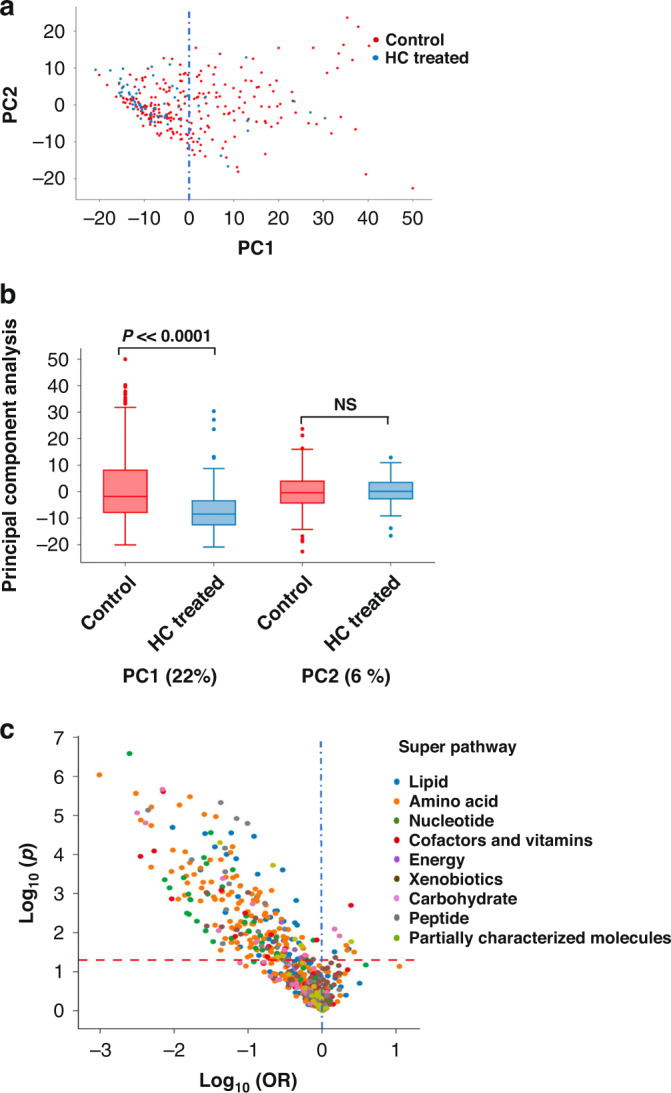
Fig. 4. Effect of HC on the urinary metabolome by cross-sectional analysis.

a PCA of 1010 metabolites with <30% imputed values. PC1 accounts for 22% of the variance in metabolite abundance between HC-treated and untreated infants with the majority reduced by HC. b Box plot. Significance of PC1 (p = 8.3e–7) and not PC2 (p = 0.65) in PCA analysis. c Volcano plot. Significant differences (above dashed red line) with HC are primarily negative (left of 0) and include metabolites of all super pathways.
