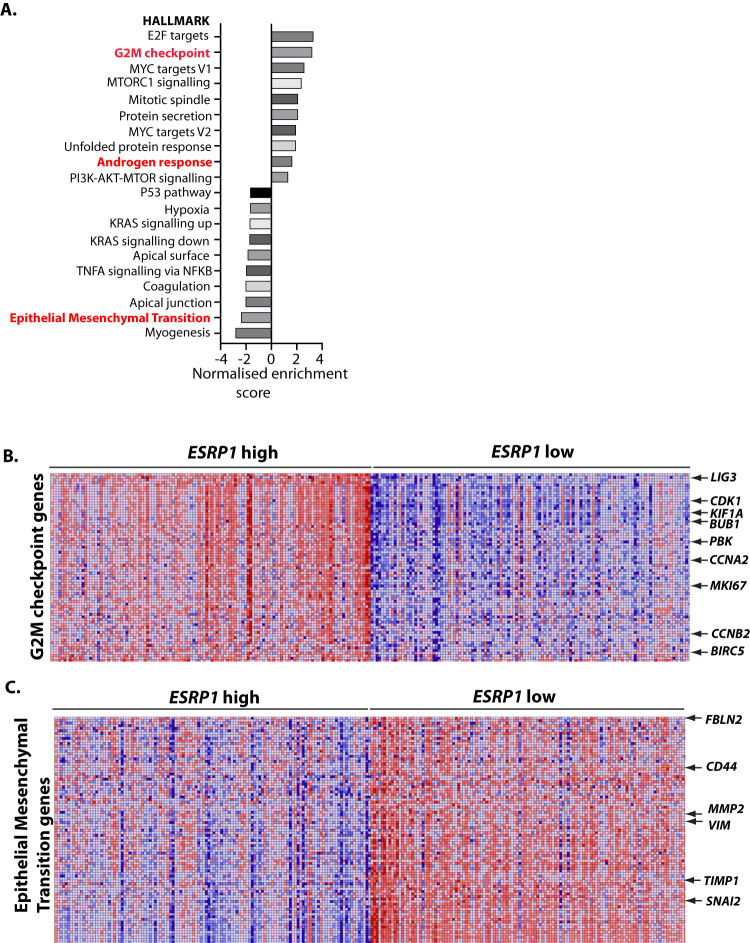
Fig. 2. High levels of ESRP1 and ESRP2 in primary prostate tumours correlate with a more proliferative gene expression profile.
A Analysis of the transcriptomes of 250 primary prostate tumours in the cancer genome atlas (TCGA) PRAD cohort identified enriched gene expression sets that correlate with ESRP1 levels. The bar chart shows positively and negatively enriched sets of gene expression in primary prostate tumours stratified by ESRP1 gene expression levels (highest and lowest 25%). B Heat map showing higher expression of genes associated with the G2M transition in ESRP1 high versus ESRP1 low tumours. C Heat map showing reduced expression of EMT-associated genes in ESRP1-high tumours versus ESRP1-low tumours.

