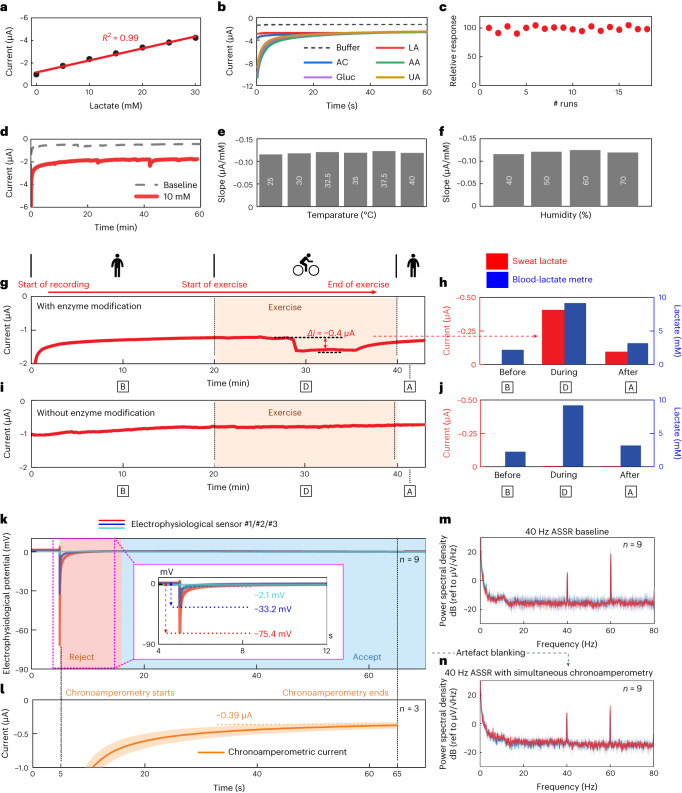
Fig. 3. Characterization of the in-ear electrochemical lactate sensing capability and integrated co-sensing capability.
a–f, Lactate sensing characterization. a, In vitro lactate sensing calibration with 5 mM lactate additions. b, Lactate sensing selectivity test. c, Lactate sensing stability results after 18 repetitive runs under a fixed concentration of 2 mM lactate. d, Operational stability evaluation by extended scan at 10 mM lactate for ~1 hr. e, Sensitivity comparison at various temperatures (25 °C, 30 °C, 32.5 °C, 35 °C, 37.5 °C and 40 °C). f, Sensitivity comparison at various relative humidity levels (40%, 50%, 60% and 70%). g–j, Representative controlled on-body lactate sensing CA recording with (g) or without (i) enzyme modification on the electrochemical electrodes, compared with simultaneous blood lactate metre reference recordings (h,j) taken at 10 min, 30 min and 40 min, respectively. k–n, Characterization of co-sensing crosstalk on three ears from two participants. k, Waveform of three 70-s 40-Hz ASSR measurements with (l) concurrent 60-s CA measurements (synchronous with EEG measurement, starting from t = 5 s and ending at t = 65 s). m, 40-Hz ASSR PSD baseline recordings without concurrent CA recording, compared with (n) same measurements with concurrent CA recording and artefact blanking (Supplementary Text Note 4). The total number of measurements taken from each individual electrophysiological or electrochemical sensor per experiment is denoted as index n in each panel. For each electrophysiological and electrochemical sensor, solid lines and shaded bands represent the participant-averaged mean ± s.d. of the measured time series and PSD.

