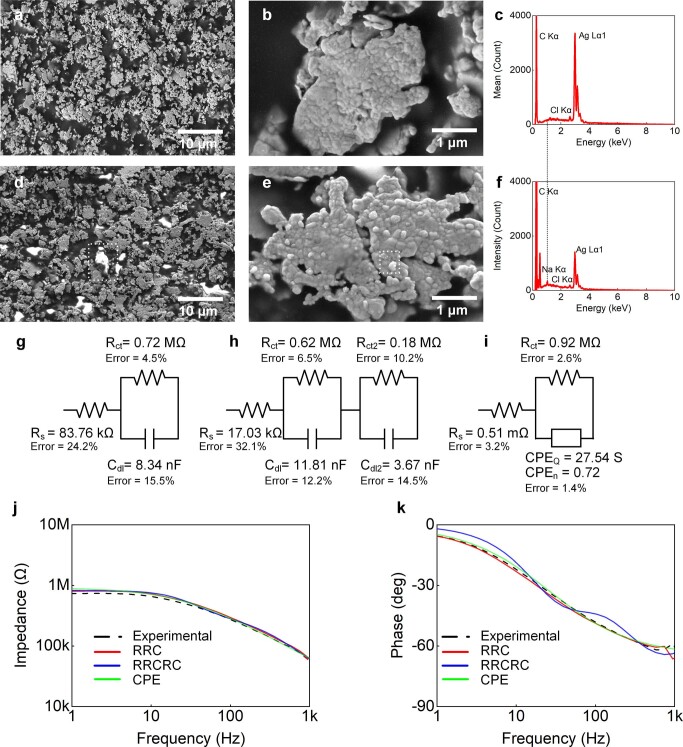
Extended Data Fig. 4. Electrophysiological electrode-ear impedance analysis.
a–f. Electrophysiological electrode composition characterization before and after interfacing with the ear canal. Pre-insertion SEM (scanning electron microscope) at two magnifications (a) and (b), and (c) EDS (energy-dispersive X-ray spectroscopy) of the electrophysiological electrodes. The EDS is the average of three scanned surface locations on the electrophysiological electrode. Post-insertion SEM at two magnifications (d) and (e), and (f) EDS of the electrophysiological electrodes. Sweat residue was observed in the SEMs and indicated by a 176% increase in the intensity of Na+ in the EDS. g–k. Equivalent model fitting results with the (g) RRC model, (h) the RRCRC model, and (i) the constant phase element (CPE) model. (j) Magnitude fitting results. (k) Phase fitting results.

