Fig. 1.

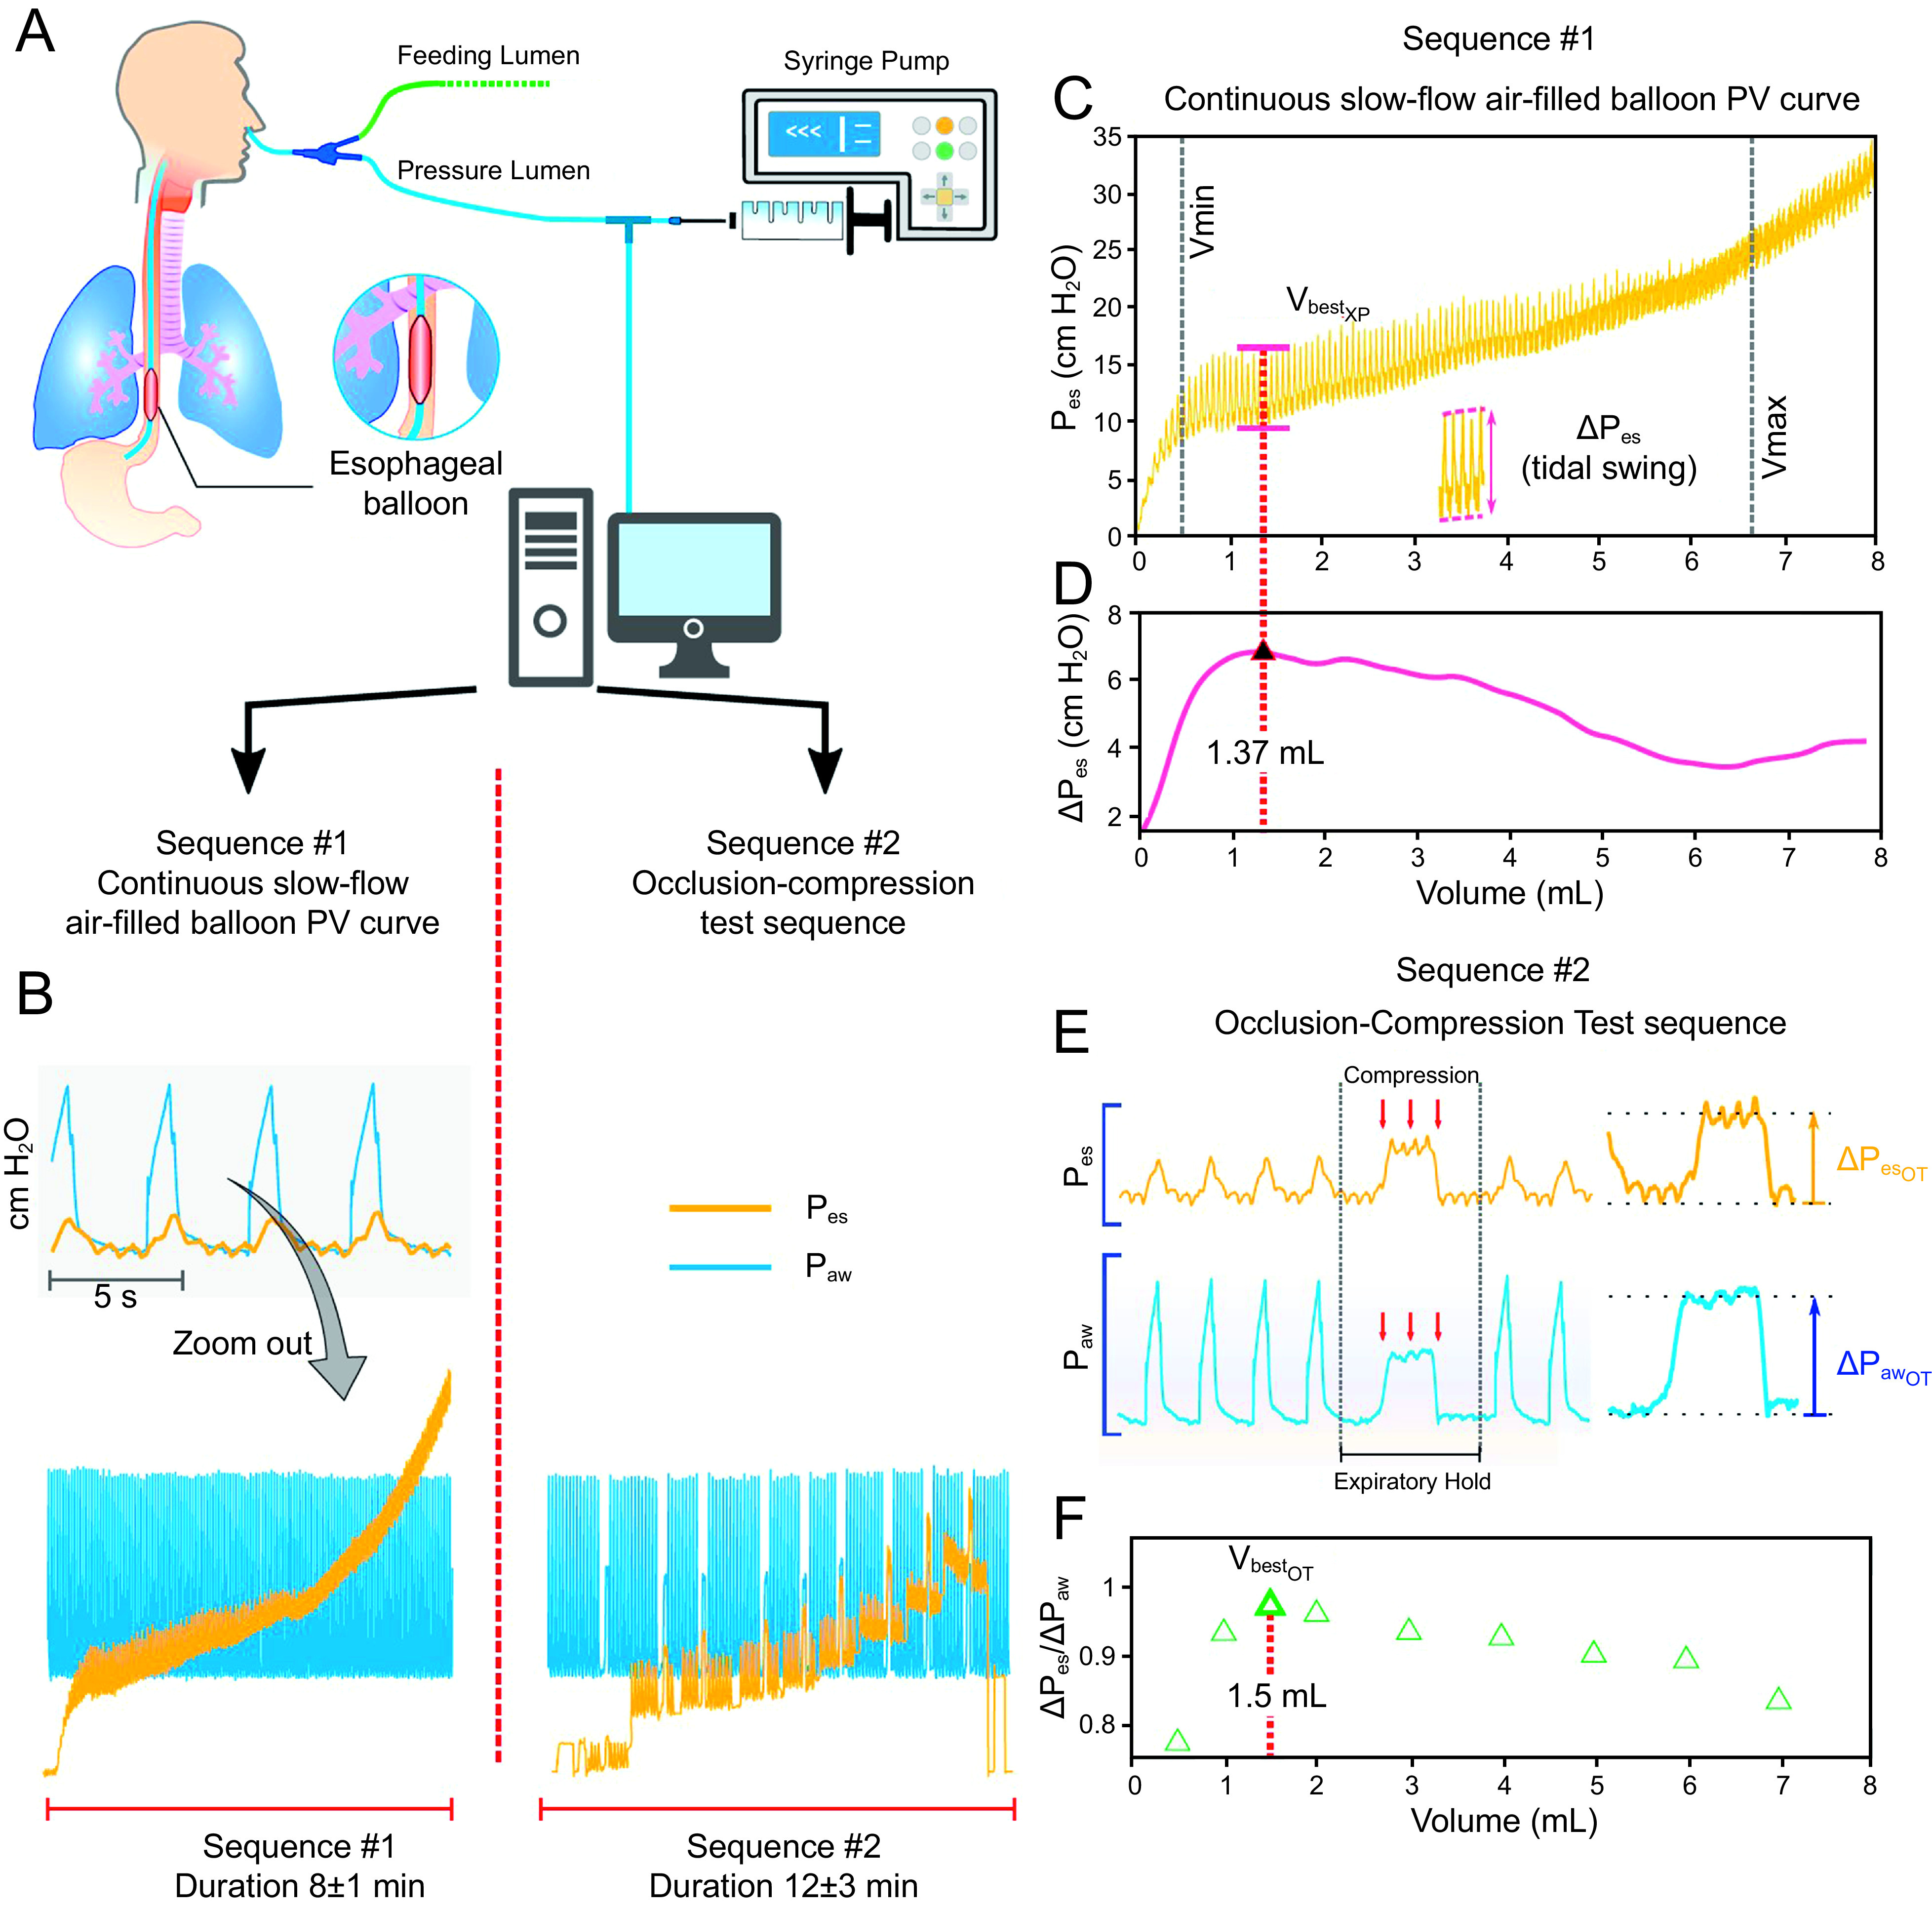
Synopsis of experimental protocol. Fig 1A: Set-up of experimental protocol for high-resolution dynamic esophageal balloon pressure-volume (PV) curve. Esophageal balloon was filled with air with a piloted syringe (filling balloon at rate of 100 mL/h, ie, 1.67 mL/min). Fig 1B: Air-filled esophageal balloon PV curve built with a continuous slow-flow inflation sequence (and subsequent occlusion test [OT] maneuver): recording and graphical/computerized analysis. Fig 1C–D: Continuous slow-flow PV curve graphics focus on VbestXP: recording and graphical/computerized analysis. C: Volume balloon with maximal Pes tidal variation. D: Analytics of dynamic PV curve leading to an estimate of VbestXP = 1.37 mL. Fig 1E–F: Detailed description focused on OT sequence. E: Computation of OT (as ΔPes/ΔPaw ratio) at each volume step (see text for detailed description of OT sequence). F: Maximal ratio defining VbestOT (top green triangle): here VbestOT = 1.5 mL, which closely match with VbestXP (1.37 mL) estimated by our experimental method (panel D). PV = pressure-volume; Pes = esophageal pressure; esp = expiratory; Paw = airway pressure; OT = occlusion test.
