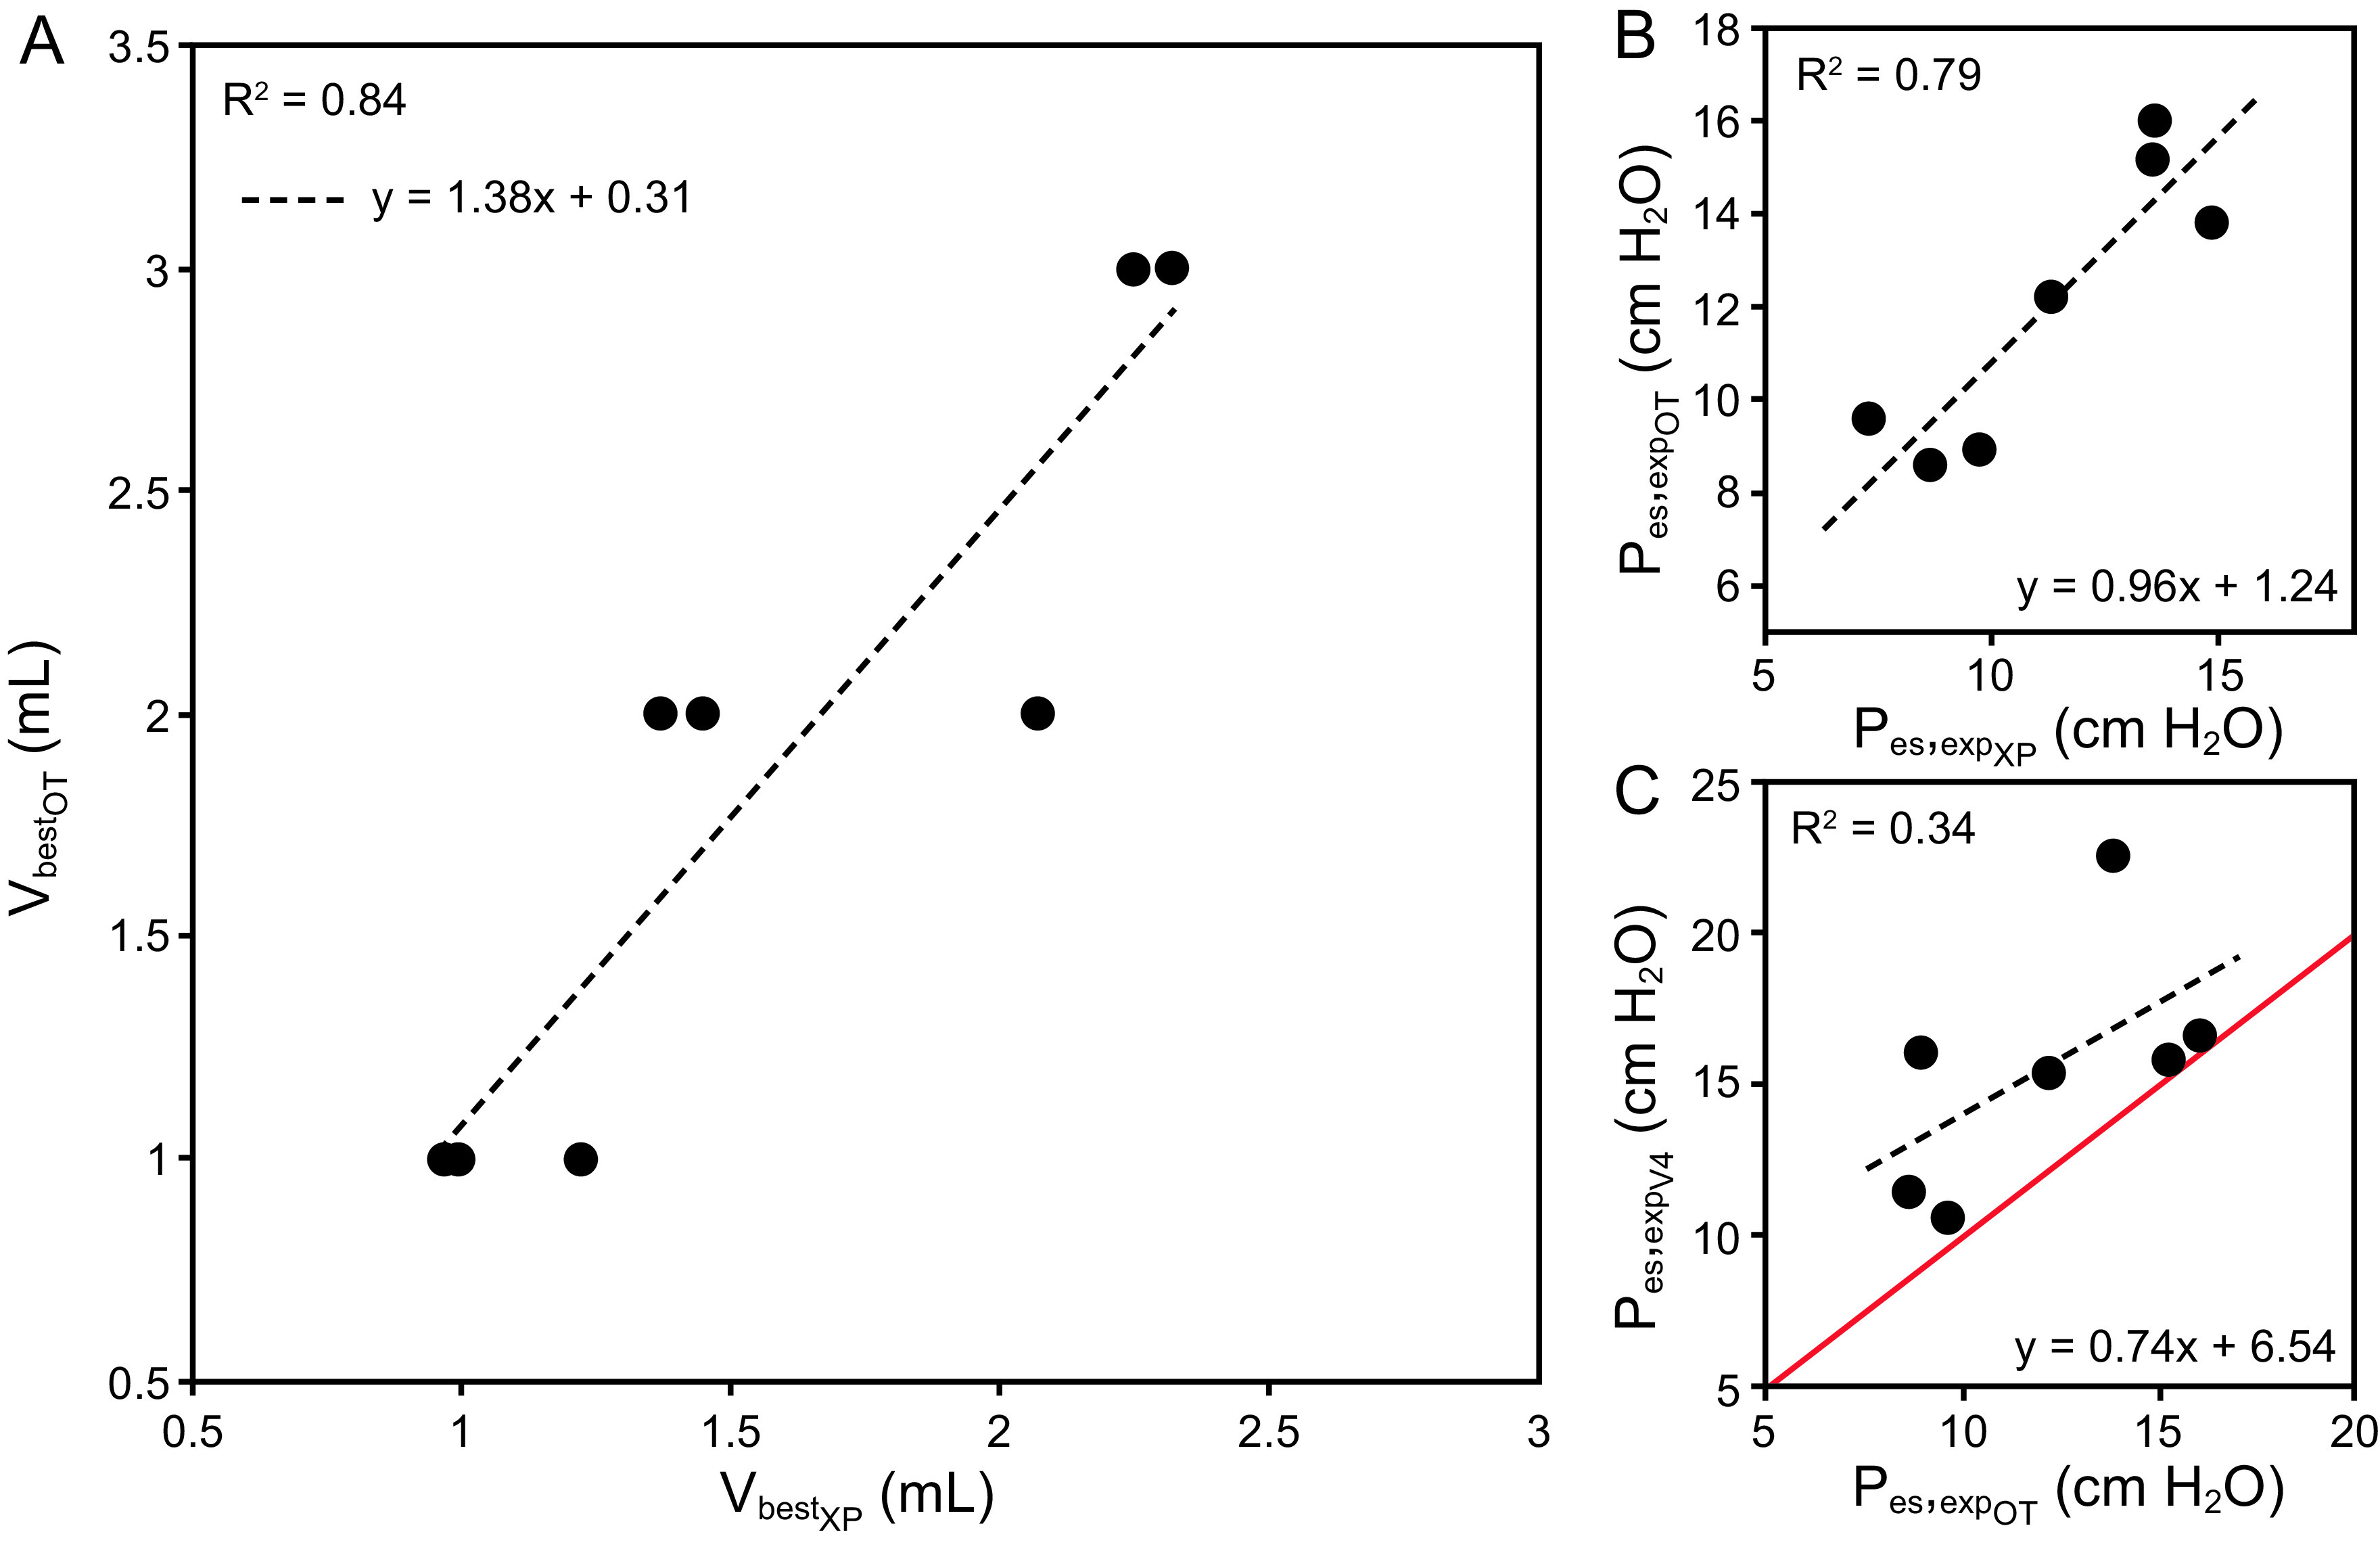
Fig. 2.

Reliability of experimental data versus reference. A: Scatterplot of the VbestOT versus VbestXP relationship (dots) superimposed with its associated linear fit (dashed line). B: Scatterplot of the Pes,expOT versus Pes,expXP relationship (dots) superimposed with its associated linear fit (dashed line). C: Scatterplot of the Pes,expOT versus Pes,expV4 relationship (dots) superimposed with its associated linear fit (dashed line). Linear coefficients, intercepts, and R2 statistics are displayed for each panel. V = volume; OT = occlusion test; XP = experimental slow-flow method variables; Pes = esophageal pressure; exp = expiratory; V4 = 4 mL volume.
