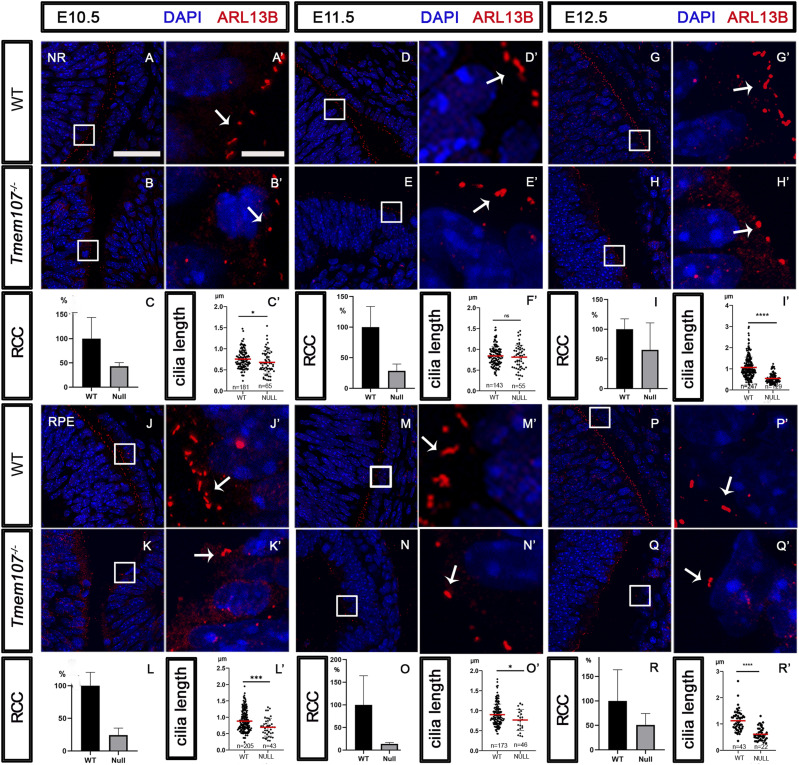
Figure 5. Primary cilia in neural retina (NR) and retinal pigment epithelium (RPE) Labeling of primary cilia using ARL13B (red) ciliary protein.
(A, A´, B, B’, D, D´, E, E’, G, G´, H, H’) In comparison with WT animals (A, A´, D, D´, G, G´), reduced number and length of primary cilia in NR of E10.5 (B, B’), E11.5 (E, E’), and E12.5 (H, H’) Tmem107−/− compared with WT embryos. (C, C’, F, F’, I, I’) Graphs representing difference in cilia number in WT (RCC, ratio of ciliated cells) and Tmem107−/− NR (C, F, I) and difference in cilia length (μm) in WT and Tmem107−/− NR (C’, F’, I’). (J, J’, K, K’, M, M’, N, N’, P, P’, Q, Q’) Comparison of primary cilia in RPE area between WT (J, J´; M, M´; P, P´) and Tmem107−/− display reduced number and length of primary cilia in RPE of E10.5 (K, K’), E11.5 (N, N’), and E12.5 (Q, Q’). (L, L’, O, O’, R, R’) Graphs representing difference in cilia number in WT and Tmem107−/− RPE (L, O, R) and difference in cilia length in WT and Tmem107−/− RPE (L’, O’, R’). Nuclei are counterstained with DAPI. Scale bars: lower magnification = 35 μm; higher magnification = 5 μm. n = number of measured cilia; nonparametric unpaired two-tailed t test; ns, nonsignificant; *P < 0.05; **P < 0.01; ****P < 0.0001.

