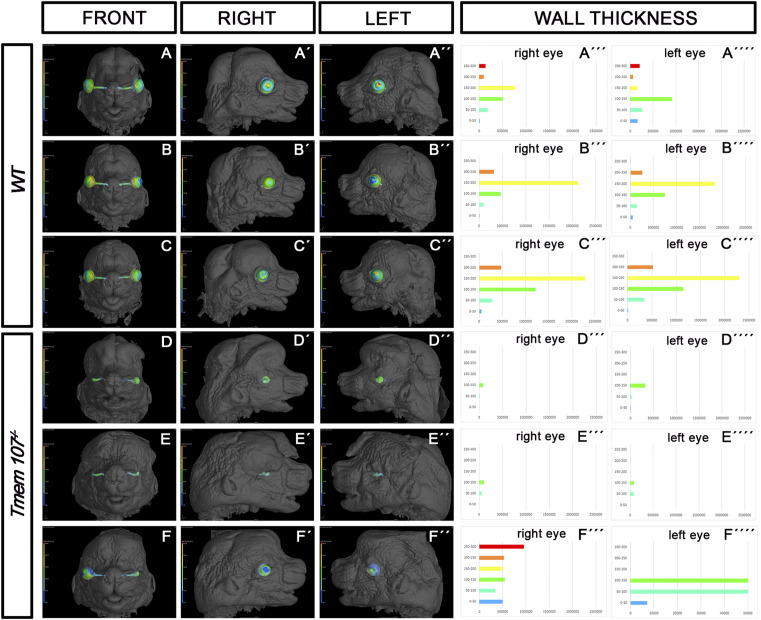
Figure S1. Wall thickness analysis of the eye.
(A, A’, A’’, B, B’, B’’, C, C’, C’’, D, D’, D’’, E, E’, E’’, F, F’, F’’) Micro-computed tomography (CT) analysis of Tmem107−/− animals at E15.5. (A, A’, A’’, B, B’, B’’, C, C’, C’’, D, D’, D’’, E, E’, E’’, F, F’, F’’) Tmem107−/− animals (D, D’, D’’, E, E’, E’’, F, F’, F’’) exhibit smaller optic cup, shorter optic nerve length ,and higher variability in optic cup size compared with WT (A, A’, A’’, B, B’, B’’, C, C’, C’’). (A’’’, A’’’’, B’’’, B’’’’, C’’’, C’’’’, D’’’, D’’’’, E’’’, E’’’’, F’’’, F’’’’) Graphical demonstration of wall thickness differences in Tmem107−/− (D’’’, D’’’’, E’’’, E’’’’, F’’’, F’’’) compared with WT (A’’’, A’’’’, B’’’, B’’’’, C’’’, C’’’’).

