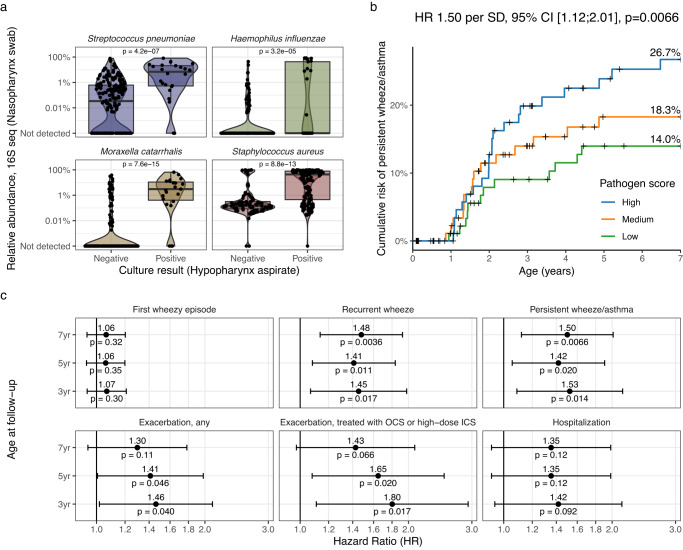
Fig. 2. Nasopharyngeal microbiota associates with hypopharyngeal culture and childhood asthma.
a Comparison of results from culturing of hypopharyngeal aspirates with relative abundance values from 16S rRNA gene sequencing of nasopharyngeal swabs, for each of the four species identified in the cultures. Box plots indicate median (middle line), 25th, 75th percentile (box), and 1.5× interquartile range (whiskers). P values are from Wilcoxon tests. b Kaplan–Meier curve showing the risk of asthma by each tertile of summed relative abundance of Streptococcus pneumoniae, Haemophilus influenzae, and Moraxella catarrhalis (pathogen score) with 7-year risk estimates per curve. Censoring is marked with +. c Associations between the pathogen score and asthma-related endpoints at 3, 5, and 7 years. All Hazard Ratios (HR, dots) are quantified per standard deviation (SD) increase in the pathogen score with corresponding 95% confidence intervals (error bars), calculated with Cox proportional hazards regression. OCS oral corticosteroid, ICS Inhaled corticosteroid. N = 285. Data from the COPSAC2000 cohort. P values are two-sided and not adjusted for multiple comparisons.

