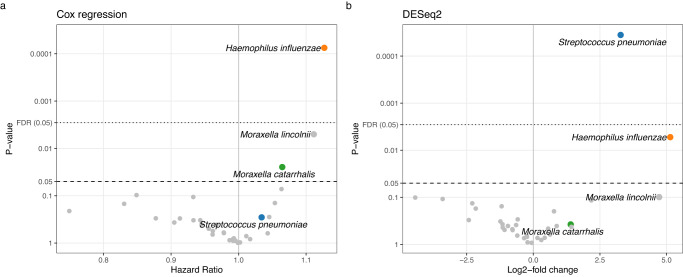
Fig. 3. Individual taxa and childhood asthma risk.
Differential abundance tests of individual bacterial species and asthma by age 7, using two different statistical models; a Cox regression of time-to-asthma quantified as Hazard Ratio per log2 increase in species relative abundance and b DESeq2 analysis comparing abundance of the species between children who later developed asthma vs those who did not. The same set of four species, that are significant in either analysis, are highlighted. FDR, false discovery rate. N = 285. Data from the COPSAC2000 cohort. P values are two-sided and not adjusted for multiple comparisons—instead, the False Discovery Rate (FDR) cutoff is shown with a dotted line.

