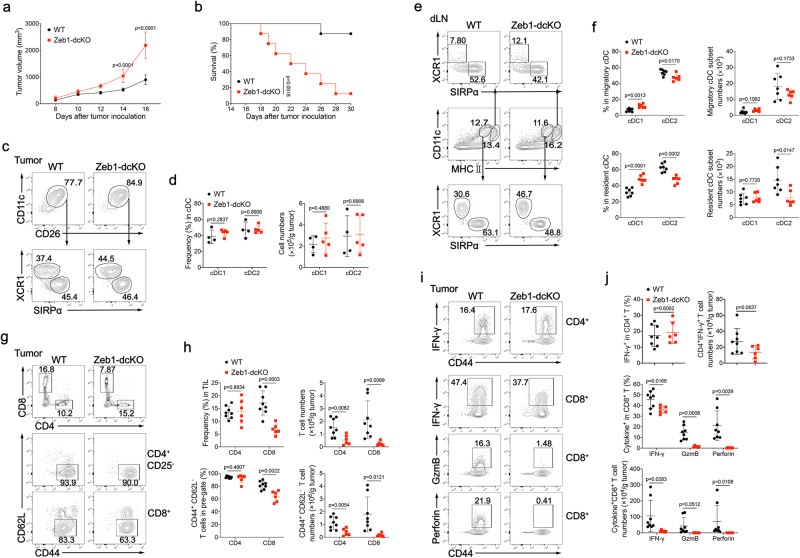
Fig. 3. DC-specific deletion of Zeb1 impairs antitumor immunity.
Tumor growth (a) and survival curves (b) of WT and Zeb1-dcKO mice injected subcutaneously (s.c.) with 2 × 10⁵ B16F10 melanoma cells (n = 8). c Flow cytometry of Lin-CD45+CD64-F4/80-MHC II + myeloid cells was used to identify cDC1 (XCR1+SIRPα−) and cDC2 (XCR1−SIRPα+) subsets in tumor from WT and Zeb1-dcKO mice at day 12 after s.c. injection with 2 × 10⁵ B16F10 melanoma cells. d Frequencies and numbers of cDC1 and cDC2 among CD11c+CD26+ cDC in tumors of WT and Zeb1-dcKO mice as in c (WT, n = 4; Zeb1-dcKO, n = 5). e Flow cytometry of live Lin−Ly6C− myeloid cells was used to identify migratory and resident cDC1 and cDC2 in tumor dLN of mice as in c. f Frequencies and numbers of cDC1 and cDC2 among migratory or resident cDC in tumor dLN of mice as in c (WT, n = 7; Zeb1-dcKO, n = 6). g Flow cytometry of tumor infiltrating leukocytes (TILs) (top row), TIL CD4+ T cells (middle row), TIL CD8+ T cells (bottom row) in tumor from mice as in c. h Frequencies and numbers of TIL CD4+ or CD8+ T cells (among TILs) (top row) and CD44+CD62L− CD4+ (among TIL CD4+ T cells) or CD44+CD62L− CD8+ (among TIL CD8+ T cells) activated T cells (bottom row) in tumor from mice as in c (WT, n = 8; Zeb1-dcKO, n = 6). i Flow cytometry of TIL CD4+ T cells (Top row), TIL CD8+ T cells (bottom rows) in tumor from mice as in c. j Frequencies and numbers of IFN-γ-producing CD4+ T cells (among TIL CD4+ T cells) and of IFN-γ-, Granzyme B- and Perforin-producing CD8+ T cells (among TIL CD8+ T cells) in tumor from mice as in c (WT, n = 8; Zeb1-dcKO, n = 6). Each symbol represents an individual mouse, small horizontal lines indicate the mean (±s.d.). Data are representative of three independent experiments. Data are presented as mean ± s.d. Statistical analysis was performed using two-tailed unpaired Student’s t-test (d, f, h, j), or two-way ANOVA with Sidak’s multiple comparisons test (a), or log-rank (Mantel–Cox) test of survival curve (b). Source data are provided as a Source Data file.

