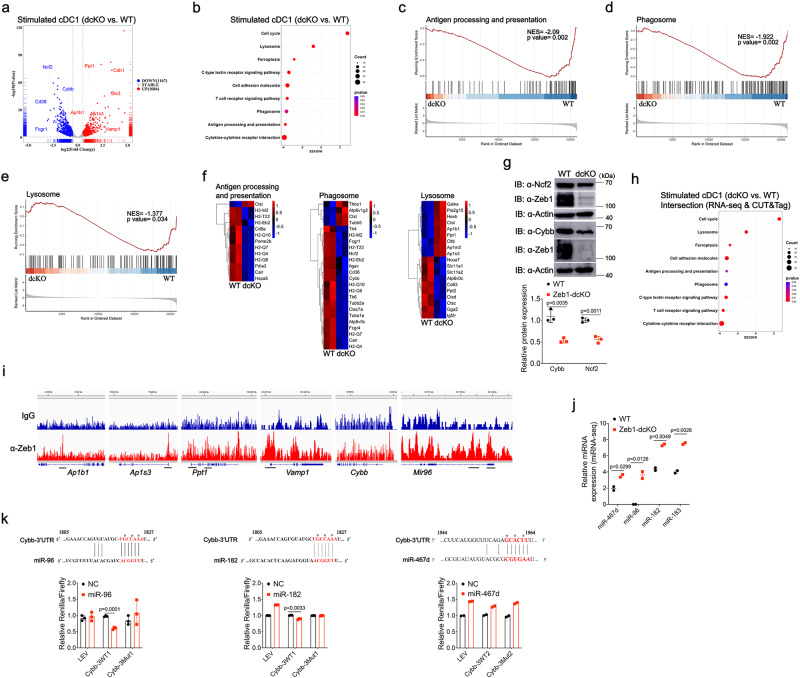
Fig. 5. Integrated analysis of transcriptomes and Zeb1 occupancy identifies Zeb1 target genes that support cross-presentation.
a Volcano plot illustrating DEGs in WT and Zeb1-deficient Flt3L-cDC1 challenged with HKLM-OVA for 4 h (n = 2). b Bubble plot depicting KEGG pathway analysis of DEGs in WT and Zeb1-deficient Flt3L-cDC1 after stimulation as in a (n = 2). GSEA profiles of KEGG pathways of antigen processing and presentation (c), phagosome (d), lysosome pathway (e), in WT and Zeb1-deficient Flt3L-cDC1 after stimulation as in a. f Heatmaps of differentially expressed signature genes in pathways of antigen processing and presentation, phagosome and lysosome in WT and Zeb1-deficient Flt3L-cDC1 after stimulation as in a (n = 2). g Immunoblot analysis of NOX2 subunits Cybb and Ncf2 in WT and Zeb1-deficient Flt3L-cDC1 after stimulation with HKLM-OVA for 4 h. Relative protein level is quantified by normalization to actin protein (n = 3, from 3 independent experiments). h Bubble plot presenting KEGG pathway analysis of DEGs in intersection of Zeb1-regulated genes obtained from above bulk RNA-seq and Zeb1-bound genes obtained from CUT&Tag with Flt3L-cDC1 after stimulation. i Integrative Genomics Viewer (IGV) showing Zeb1 binding peaks (CUT&Tag) in indicated gene loci of WT Flt3L-cDC1 challenged with HKLM-OVA for 4 h. j miRNA-seq illustrating expression levels of the indicated miRNAs in WT and Zeb1-deficient Flt3L-cDC1 challenged with HKLM-OVA for 4 h (n = 2 biologically independent samples in one experiment). k Relative luciferase activity in HEK293T cells transfected with dual reporter vector containing WT or mutated miR-96/182- or miR-467d-binding sites in Cybb together with empty or miR-96- or miR-182- or miR-467d-expressing vector. Renilla luciferase activity is normalized to firefly luciferase activity. * marked on nucleotides represents mutated sites. Each symbol represents an individual sample, small horizontal lines indicate the mean (±s.d.). Data are representative of three independent experiments (g, k) (error bars, s.d.). Data are presented as mean ± s.d. Statistical analysis was performed using two-tailed unpaired Student’s t-test. Source data are provided as a Source Data file.

