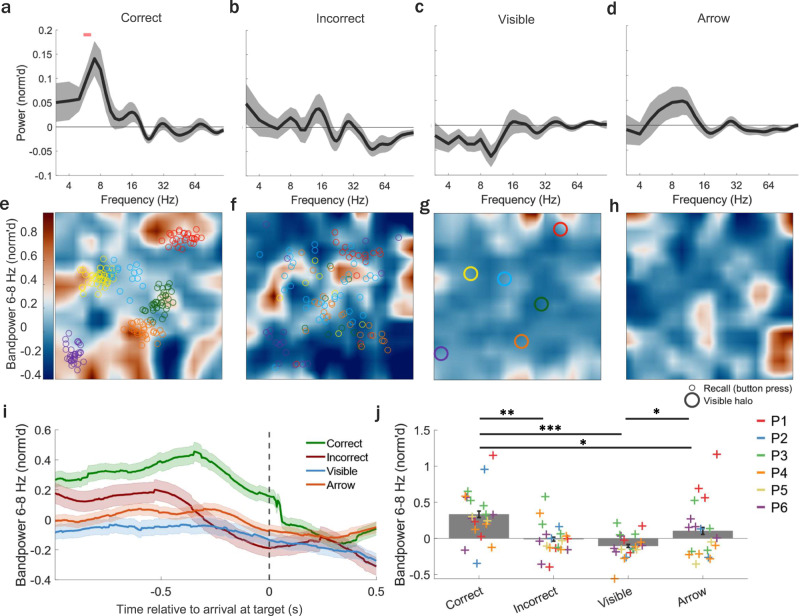
Fig. 3. MTL theta band power increased during correct compared to incorrect retrieval, visible halo, or arrow trials.
a–d Mean (±s.e.m.) normalized (norm’d) power across MTL channels (nchannels = 19) for frequencies 3–120 Hz during the 0.5 s period prior to either the button press during a correct or b incorrect recall during retrieval trials, or c arrival at visible halos during feedback, or d arrival at arrows during arrow trials. MTL theta band power significantly increased during correct but not incorrect retrieval, visible halo, or arrow trials. Horizontal pink bar indicates significant power increase/decrease (p < 0.05, corrected using false discovery rate [FDR]19,20). Top-down view of norm’d theta band power (6–8 Hz) in an example MTL channel averaged across all samples during retrieval e correct, f incorrect, g visible halo, and h arrow trials. Note, halos were not visible during correct or incorrect retrieval nor during arrow trials. e, f Colored circles reflect all recalled locations during retrieval for correct and incorrect trials. g Colored circles reflect locations of halos during visible feedback. i Mean (±s.e.m.) norm’d theta band power across MTL channels (nchannels = 19). Vertical gray dotted line (time = 0) indicates the moment (button press) when participants arrived at the remembered halo position (correct/incorrect) during retrieval trials, visible halo (visible, blue) during feedback, or arrow (orange) during arrow trials. j Mean (±s.e.m.) norm’d theta band power across MTL channels (nchannels = 19) during correct/incorrect trials, visible feedback periods, and arrow trials. MTL theta band power significantly increased during the 0.5 s prior to arrival at the target position for correct compared to incorrect, visible (feedback), and arrow trials (correct vs. incorrect p = 0.003, correct vs. visible p = 0.0004, incorrect vs. visible p = 0.19, correct vs. arrow p = 0.047, arrow vs. incorrect p = 0.28, arrow vs. visible p = 0.022). Crosses (+) represent the mean norm’d band power across all trials for an individual channel with each color corresponding to channels from a single participant. * = p < 0.05, ** = p < 0.01, *** = p < 0.0001, two-sided pairwise permutation test, FDR corrected. Source data are provided as a Source Data file.

