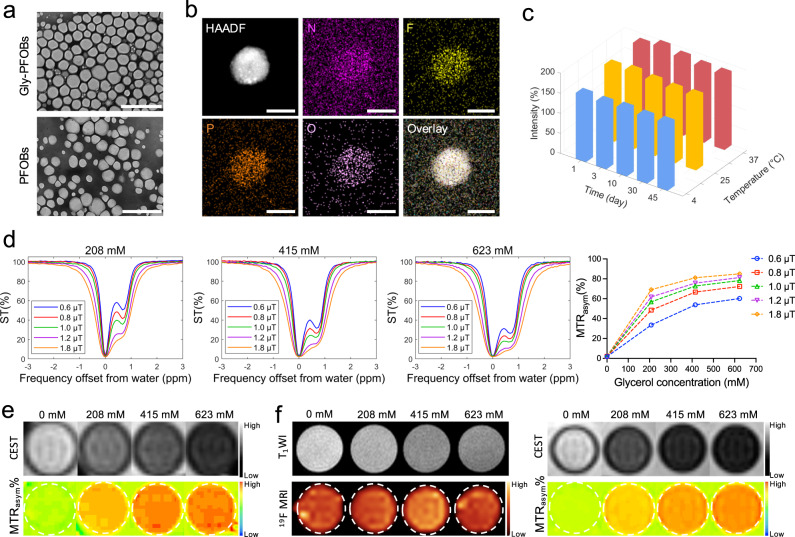
Fig. 2. Characterization of 19F/1H-CEST dual-imaging modality Gly-PFOBs.
a Morphologies of Gly-PFOBs and control probes without CEST signals (PFOBs) were determined by TEM. Scale bars, 1 μm. Repeated three times independently with similar results. b Elemental mapping analysis of Gly-PFOBs, repeated one time. Scale bars, 50 nm. c Measurement of changes in the intensity-averaged mean particle size (hydrodynamic particle diameter) of Gly-PFOBs, n = 5 independent measurements. Three-dimensional (3D) graphs were generated using Matlab based on the average values obtained. d CEST signal properties of Gly-PFOBs with different glycerol concentrations (0 mM, 208 mM, 415 mM, and 623 mM) at different saturation pulse powers (0.6 μT, 0.8 μT, 1.0 μT, 1.2 μT, and 1.8 μT). Repeated three times independently with similar results. e 1H-CEST MR imaging results of aqueous glycerol solutions with different concentrations. Repeated 3 times independently with similar results. f T1WI, 19F/1H-CEST MR imaging results of Gly-PFOBs with different glycerol concentrations. Repeated 3 times independently with similar results. CEST chemical exchange saturation transfer, MTRasym magnetization transfer ratio asymmetry, ST% saturation frequency. Source data are provided as a Source data file.

