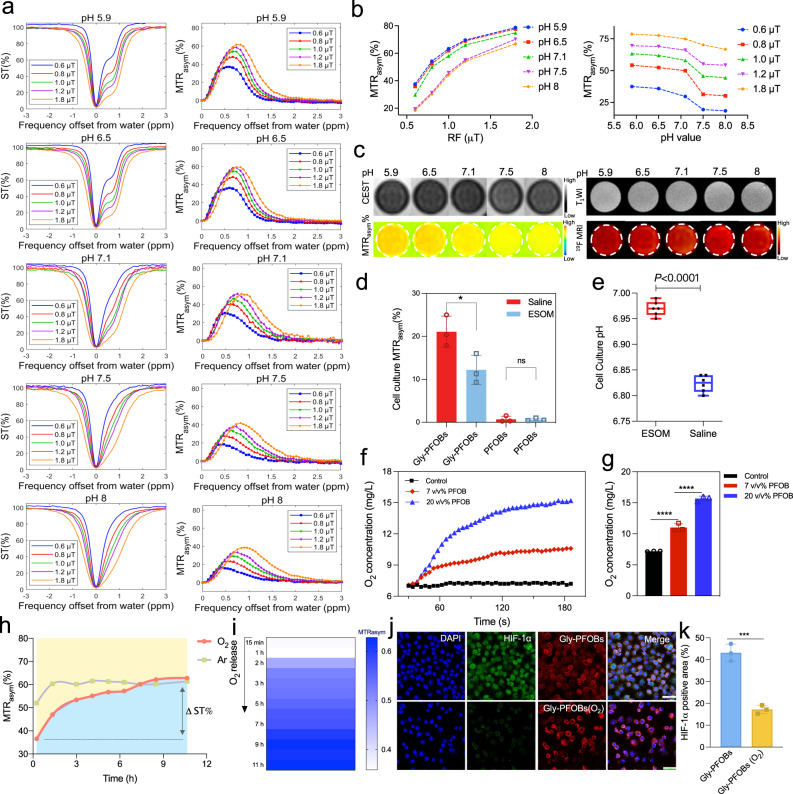
Fig. 3. In vitro pH and O2 dual sensitivities and hypoxia alleviation by oxygenated Gly-PFOBs.
a Z-Spectra and MTRasym curve of the Gly-PFOBs at different pH values and saturation pulse powers (0.6 μT, 0.8 μT, 1.0 μT, 1.2 μT, and 1.8 μT, 5 s), and corresponding statistical analysis (b). c 1H-CEST MRI (1.0 μT, 5 s), T1WI, and 19F-MRI results of Gly-PFOBs in different pH solutions. a–c Repeated 3 times independently with similar results. d Comparison of CEST signal intensity between Gly-PFOBs and PFOBs in the supernatant of NCI-H460 cells incubated with ESOM or saline, *P < 0.05 (P = 0.0364); n.s indicates no statistical significance (P > 0.05, P = 0.9049). Two-tailed, unpaired t test. Data are presented as mean ± SD (n = 3 biologically independent samples). e The pH value of the supernatant of NCI-H460 cells incubated with ESOM or saline in pHmed for 2 h were measured by pH-sensitive optical microsensor, ****P < 0.0001. Two-tailed, unpaired t test. Data are presented as mean ± SD (n = 6 biologically independent samples). In the boxplots, the center line, box limits, and whiskers denote the median, upper and lower quartiles, and 1.5 × interquartile range, respectively. f Measurement of oxygen loading and gradual release from PFOB saturated with oxygen in deoxygenated water and corresponding statistical analysis (g), ****P < 0.0001. One-way ANOVA with Sidak’s multiple comparisons test. Data are presented as mean ± SD (n = 3 independent measurements). h CEST signal intensity changes of Gly-PFOBs with oxygen and argon (Ar) release over time. Data are presented as mean ± standard deviation (SD), n = 3 independent experiments). i CEST signal intensity changes of Gly-PFOBs with oxygen release. Repeated three times independently with similar results. j Immunofluorescence results of HIF-1α staining of NCI-H460 hypoxic cells co-incubated with Gly-PFOBs with or without oxygenation and corresponding statistical results (k). ***P < 0.001 (P = 0.0005). Two-tailed, unpaired t test. Data are presented as mean ± SD (n = 3 biologically independent experiments). Scale bar: 50 μm. ESOM: esomeprazole. Source data are provided as a Source data file.

