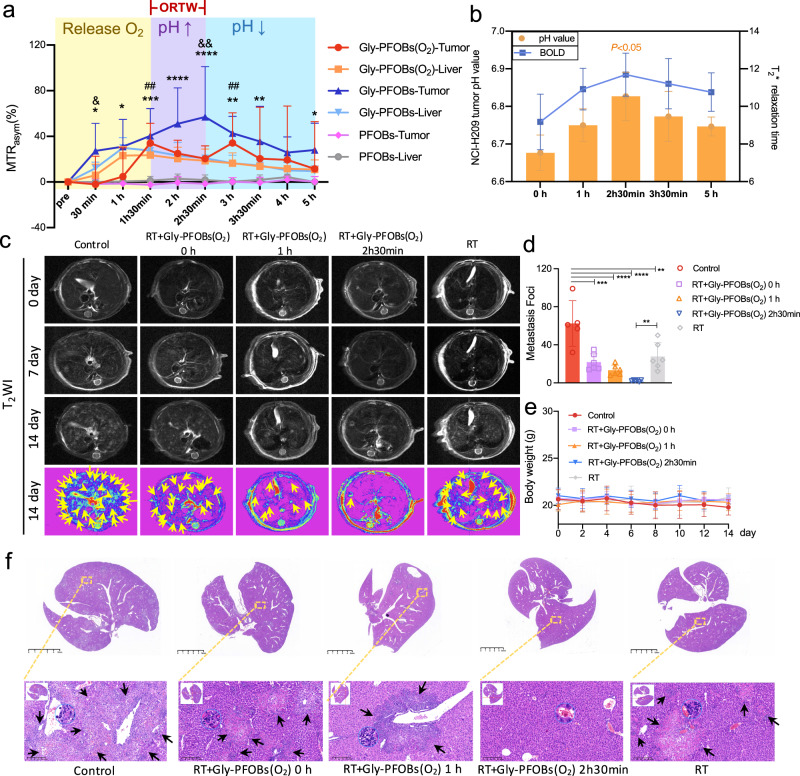
Fig. 6. ORTW and RT outcomes in SCLC metastasis in the liver.
a Dynamic CEST MR “M-type” signal changes curve of H209 SCLC liver metastasis and normal liver tissue after the injection of Gly-PFOBs(O2), Gly-PFOBs, and PFOBs. *Gly-PFOBs-Tumor vs. PFOBs-tumor,*P = 0.035, 30 min; *P = 0.0109, 1 h; ***P = 0.0002, 1h 30 min; ****P < 0.0001, 2 h, 2h 30 min; **P = 0.0002, 3 h; **P = 0.0028, 3h 30 min; *P = 0.0476, 5 h; # Gly-PFOBs(O2)-Tumor vs. PFOBs-tumor, ##P = 0.0024, 1h 30 min; ##P = 0.0061, 3 h; & Gly-PFOBs(O2) -Tumor vs. Gly-PFOBs-tumor, &P = 0.0298, 30 min; &&P = 0.0023, 2h 30 min. Two-way ANOVA, Tukey’s multiple comparisons test. Data are presented as mean ± SD (n = 6 mice). b Determination of the pH changes and T2*values in TME before and after Gly-PFOBs(O2) (pH of 2 h 30 min vs. 0 h, *P = 0.0331). One-way ANOVA, Tukey’s multiple comparisons test. Data are presented as mean ± SD (n = 3 biologically independent measurements). c Representative T2WI MR images of mice liver in each treatment group. Yellow arrow points to H209 SCLC liver metastasis. d H209 SCLC liver metastasis foci on each liver were counted. **P = 0.0013; ***P = 0.0002; ****P < 0.0001. One-way ANOVA, Tukey’s multiple comparisons test. Data are presented as mean ± standard deviation (SD), n = 6 mice for all groups except control group (n = 5). e Body weight changes of mice in each treatment group. Data are presented as mean ± standard deviation (SD), n = 3 mice. f Representative H&E-stained liver slices collected from mice after the indicated treatment on day 14. Black arrow points to H209 SCLC liver metastasis. Scale bar: 5 mm, and corresponding enlarged lung metastasis sections. Scale bar: 200 μm. n = 5 biologically independent samples for all groups except control group (n = 3). ORTW optimized radiotherapy time window, BOLD blood oxygen level-dependent, RT radiotherapy. Source data are provided as a Source data file.

