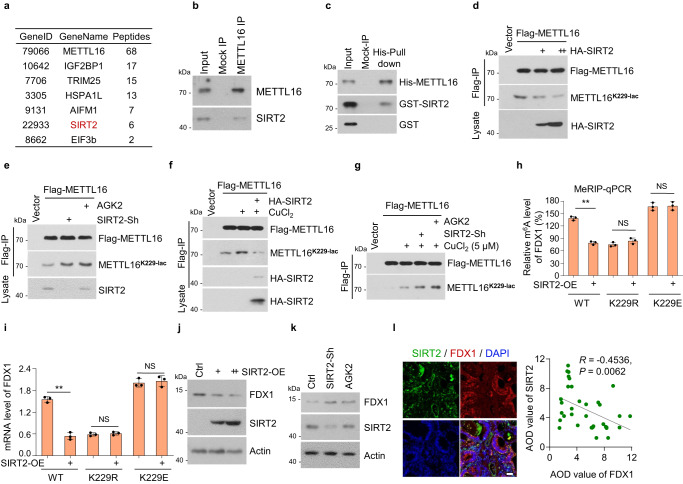
Fig. 6. SIRT2 delactylates METTL16-K229 and inhibits the activity of METTL16.
a Identification of METTL16-associated proteins using liquid chromatography-tandem mass spectrometry (LC-MS/MS). b, c Western blot verification of the interaction between METTL16 and SIRT2 in HGC-27 cells. b Endogenous METTL16 in HGC-27 cells was precipitated using the anti-METTL16 antibody or IgG (mock IP). Co-precipitated SIRT2 was detected by western blot. c Recombinant His-tagged METTL16 was incubated with GST-SIRT2 or GST proteins at 4oC for 4 h followed by His pull-down and western blot. d, e SIRT2 inhibited copper-induced METTL16-K229 lactylation. Cell lysates were immunoprecipitated using Flag-M2 beads and western blot for total or lactylation of METTL16 using anti-Flag or METTL16K229-lac antibody. d Flag-METTL16 and HA-SIRT2 plasmids were co-transfected into HGC27 cells followed by immunoprecipitation. e The Flag-METTL16 plasmid was transfected in control or SIRT2-knockdown (SIRT2-Sh) HGC-27 cells with or without AGK2 (10 μM) treatment for 24 h. f HGC27 cells co-transfected with Flag-METTL16 and HA-SIRT2 were treated with CuCl2 (5 μM) for 12 h and followed by immunoprecipitation. g The flag-METTL16 plasmid was transfected in control or SIRT2-knockdown (SIRT2-Sh) HGC-27 cells with or without the treatment of AGK2 (10 μM, 24 h) or CuCl2 (5 μM, 12 h). h SIRT2 was transfected in METTL16-WT/K229R/K229E rescued cells and the relative m6A level of FDX1 was detected by MeRIP-qPCR assay (n = 3). P = 0.00371 (WT), 0.3224 (K229R), and 0.8714 (K229E). i SIRT2 was transfected in METTL16-WT/K229R/K229E rescued cells and FDX1 mRNA level was detected by the qRT-PCR assay (n = 3). P = 0.00926 (WT), 0.4222 (K229R), and 0.5107 (K229E). j Different doses of SIRT2 overexpression plasmid were transfected in HGC-27 cells, and the protein level of FDX1 was analyzed by western blot using FDX1 antibody. k Western blot of FDX1 protein level in Ctrl or SIRT2-Sh HGC-27 cells with or without AGK2 treatment. l Immunofluorescent staining of tissue microarray (T16-425) containing 54 pairs of GC and adjacent normal tissues. Representative images showing the co-expression of SIRT2 and FDX1. Pearson correlation analysis of the average optical density (AOD) value between SIRT2 and FDX1 was measured by Image J (R = −0.4536). P = 0.0062. Scale bar, 50 μm. Statistical data presented in this figure show mean values ± SD of three times of independent experiments. Statistical significance was determined by Two-tailed t test, *P < 0.05, **P < 0.01, NS not significant. Source data are provided as a Source data file.

